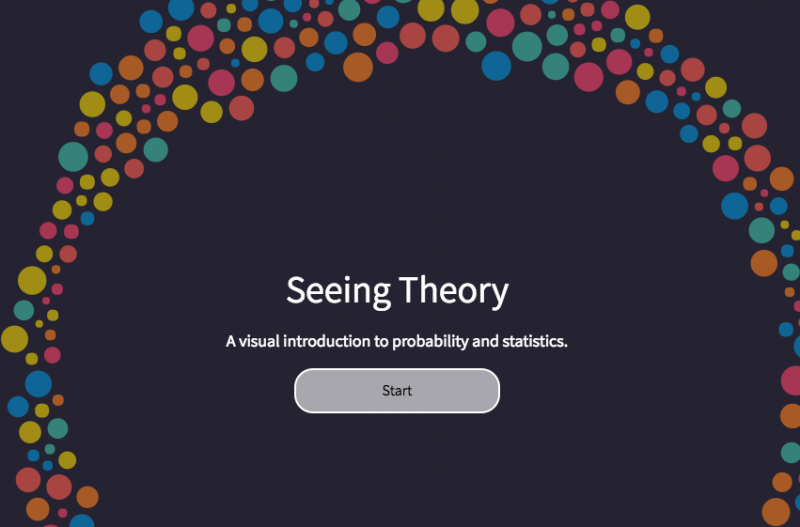
If you like pretty visualisations and statistics, we’ve found the website for you. Seeing Theory has been put together by a group of undergraduate students at Brown University in the USA, and aims to make statistics more accessible through interactive JavaScript visualisations. Starting from simple coin and dice examples, it builds up to Bayesian inference and regression analysis. It’s also very pretty!
They’re also hoping to produce an accompanying textbook, and a draft version is viewable now and looking for your feedback.
