This is part 2 of a three-part series of mathematical speculations about bees. Part 1 looked at honeycomb geometry.
Honeybees scout for nesting sites in tree cavities and other nooks and crannies, and need to know whether a chamber is large enough to contain all the honey necessary to feed their colony throughout the winter. A volume of less than 10 litres would mean starvation for the whole colony, whereas 45 litres gives a high chance of survival. How are tiny honeybees able to estimate the capacity of these large enclosed spaces, which can be very irregular and have multiple chambers?
In the paper “How might individual bees measure massive volumes?” social entomologists Nigel Franks and Anna Dornhaus suggest that honeybees might make intuitive use of the mean free path length formula.
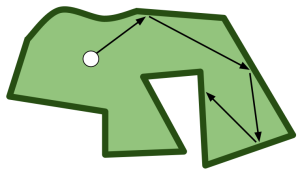
 Imagine a billiard table of any shape, with a ball (represented by a point mass, as per usual) rolling around frictionlessly and bouncing off the irregular sides. How far, on average, will the ball travel between bounces? This average is the mean free path length, which I’ll write as $\mathbb{E}(L)$.
The mean free path length is, surprisingly, independent of the shape of the billiard table: it is exactly $\mathbb{E}(L)=\pi \frac{\text{Area}}{\text{Perimeter}}$.
In a three-dimensional space, you can play the same game again (so long as you have access to a zero-gravity billiard room), which leads to the solution $\mathbb{E}(L)=4 \frac{\text{Volume}}{\text{Surface area}}$.
If you’re wondering about the constants $\pi$ and $4$ in the equations above, they are both of the form \[C_D = \frac{\text{Surface area of a }D\text{-dimensional sphere}}{\text{Volume of a }(D-1)\text{-dimensional sphere}}\] and so are unitless. A one-dimensional sphere is a line between points $-r$ and $+r$ and its ‘volume’ is its length, $2r$. Likewise, a two-dimensional sphere is a circle, whose ‘volume’ is its area, and ‘surface area’ is its perimeter. So $C_2=\frac{2\pi r}{2 r}=\pi$ and $C_3 = \frac{4 \pi r^2}{\pi r^2}=4$. These formulas are typically used by acoustic engineers and some particle physicists.
So, back to bees. Rearranging the formula to \[\text{Volume} \propto \text{Surface area} \times \mathbb{E}(L)\] provides a way of calculating or comparing volumes, but would present our humble heroes with two new problems: estimating the mean free path length and the surface area.
It’s well known that bees are able to measure flight distances. Being collaborative social insects, when they return to their nests after finding a good site for nectar or nesting, they communicate the direction of travel to other bees via a waggle dance, tracing a figure of eight over and over again, with a zigzagging dance in the middle. Not only does the dance uniquely identify a direction, but the number of zigzags is roughly proportional to the distance away of the location of interest. Bee researchers understand the waggle dance so well that they can also read the instructions, and then run off and find the location that the bees are dancing about.
However, the mechanism by which bees measure distance is less certain. One conjecture is that they are aware of either how long they have flown for, or how much energy they have used. Another is that bees use visual clues: the amount of scenery change they see whilst flying. This ‘visual odometry’ conjecture has been backed up by some brilliant research where bees flew through tunnels with various patterns on the walls. Bees that flew through a 6m tunnel with extremely random Julesz patterns reported up to about 200m flown. In tests using tunnels with stripes parallel to the bees’ direction of travel (ie. no change in the pattern) bees reported lengths of about a quarter of those who flew through the same tunnel decorated with Julesz patterns.
This gives a few ideas about how bees might measure the mean free path length, $\mathbb{E}(L)$: they can simply fly randomly in a straight line between walls a few times to get some sense of how far they travel between landings (no actual bouncing is required). Bees do make such short hopping flights between the walls of potential nest sites, otherwise unexplained behaviour that is consistent with this explanation. But how about measuring the surface area?
By carefully choosing light levels and coating the inside of wooden nest boxes with slippery fluon, lifelong bee researcher Thomas Seeley has shown that, to evaluate a potential nest site, honeybees need either sufficient light to see or to be able to walk freely around it. Honeybees’ opinions of the real estate can be visually polled by watching how many followers they attract to the nest box within a fixed period of time. Honeybees convince each other to visit the locations by performing waggle dances: the better the location, the more excited the waggle dance, and so the more followers. By constructing a cylindrical nest box with a sort of treadmill, Seeley has been able to trick exploring honeybees by making their walks back to the entrance seem either shorter or longer by rotating with or against their walking direction. In the experiments, the honeybees recruited more followers to the nest boxes where their walks back to the entrance were made artificially longer.
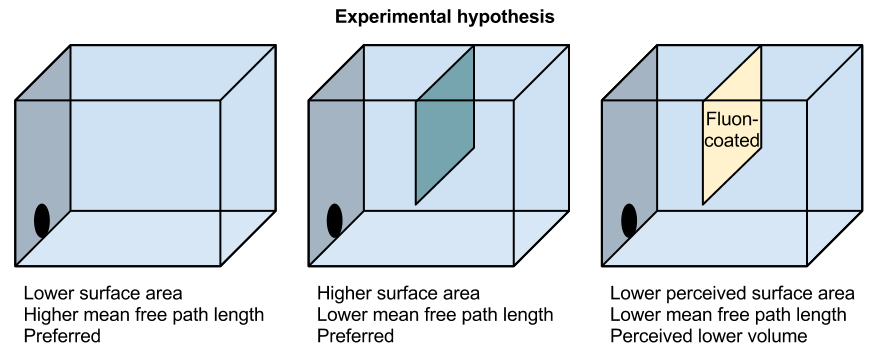
The paper by Franks and Dornhaus mentioned at the start of this article describes a similar, simple experiment to test their elegant hypothesis that bees use the connection between volume, surface area and mean free path length. As far as I know it hasn’t been carried out ((I checked with one of the authors back in June 2012, and looked for works that cite the paper just before going to press)). Three nest boxes are to be created. The first is the control, just a plain box. The second has a partition, so while the volume will be identical, the surface area is increased, and therefore the mean free path length is decreased. The third has the same partition as the second, but the partition is coated with slippery fluon, so it has the same lower walkable surface area as the control, but the lower mean free path length of the second.
If the hypothesis is correct, the bees should like the first two boxes equally, but shun the third, believing it to be smaller. It’s a wonderful experiment: it’ll be even more wonderful when someone actually performs it.
What to read next:
Thomas Seeley’s “Honeybee Democracy” describes his lifetime of scientific work investigating the collective decision-making process that honeybees use to decide on potential nesting sites (Princeton University Press have made preview of Chapter 1 available). It’s a well-written book with engaging and detailed descriptions of many fascinating honeybee experiments within an area I’d never considered, but which illustrates how an aspect of bees’ group intelligence is achieved. Chapter 3, in particular, is what inspired me to read around Franks and Dornhaus’ paper.
Unrelated puzzle about honeybee relatives:
Most humans have $2^n$ ancestors $n$ generations above (at least for small $n$). There are exceptions: for instance, some of the great-grandsons of Queen Victoria only had six great-grandparents (Victoria and Albert were their great-grandparents in two ways).
While female honeybees also have two parents of each sex, the males only have one parent: the queen bee ((This is because male bees only have half as many chromosomes as the females: meaning that female bee siblings share $3/4$ of their genes on average (instead of $1/2$ in humans), which is important for workers in a hive cooperating. This high proportion of shared inheritance means that it’s strongly in their and their genes’ evolutionary interests to help any new queens that their mother gives birth to.)). How many ancestors does a male drone bee have $n$ generations above? ((I.e. one parent, two grandparents, three great-grandparents,…)).
Apiological Part 1: Honeycomb geometry

One Response to “Apiological: mathematical speculations about bees (Part 2: Estimating nest volumes)”