This is a guest post from museum educator and mathematician Tom Briggs, about his session at last August’s Talking Maths in Public conference.
2025’s Talking Maths in Public (TMiP) conference took place on the Warwick University campus, but the Saturday morning networking and wind-down venue was the fabulous Coventry Transport Museum. A few weeks earlier I’d been asked by the TMiP organising committee if I’d like to offer something related to my work with museums, and I think it’s about time I wrote something about what happened.
We do these things, not because they are difficult, but because they are ridiculous – Matt Parker, probably
Matt Parker is going to the moon. I mean, not literally. Everyone’s favourite Stand-Up Mathematician is the sort of person who’s more likely to go to hyperspace than to space. However, when Matt was approached to do “something ridiculous” with spare computing power on a lunar rover, there was only ever going to be one outcome: an attempt to calculate \( \pi \) on the moon.
But… why?
That is an excellent question, beautifully presented. I compliment you for asking it. Next!
Moon-te Carlo
Because it’s important to do ridiculous things properly — there’s no point in going to the moon and doing calculations you could do on Earth — Matt made the decision to approximate \( \pi \) using the readings from the rover as a source of randomness for a Monte Carlo calculation.
Monte Carlo methods are typically used to work things out when it’s too difficult or too boring to do them analytically. While there were some earlier randomised calculation methods — Buffon’s needle, for example — the first real Monte Carlo experiment was done by Stanisław Ulam while recovering from an illness. Ulam wondered how likely it was that a game of solitaire would come out successfully and, rather than calculate it properly, decided to play a hundred games and count how many they won. It was a short step from there to the atomic bomb.
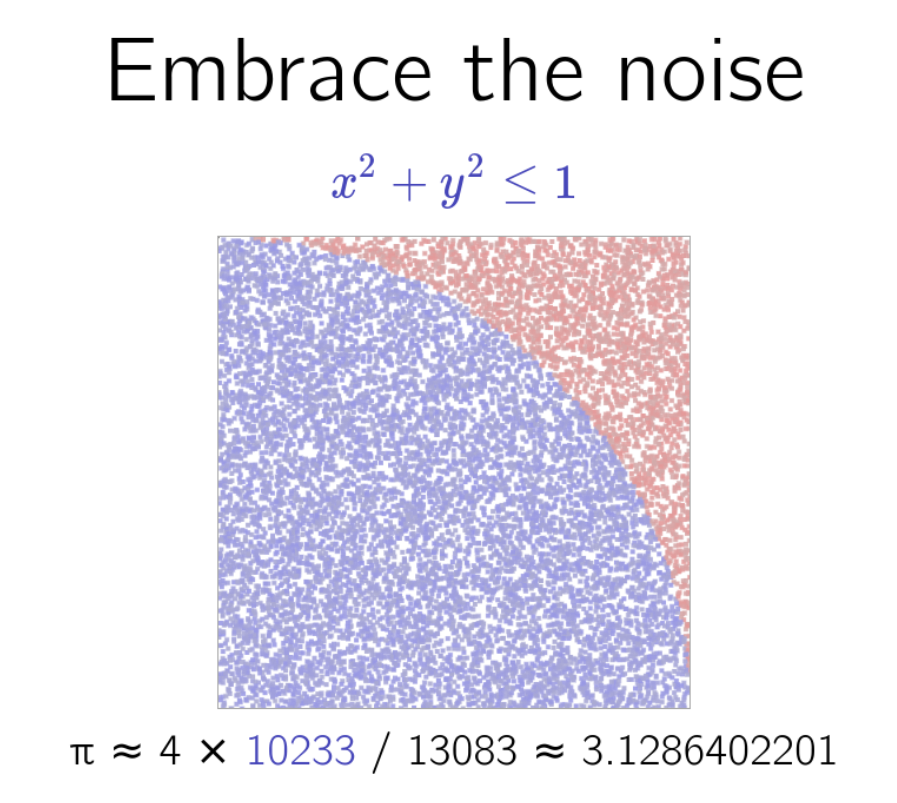
Matt showed the standard Monte Carlo approach to calculating \( \pi \) in the video announcing the moon \( \pi \) project — it’s often used as a simple example when introducing the idea. If you put a circular dartboard in a square box that just fits it, and threw darts at the box, assuming you were equally likely to hit any point in the box, each dart would have a probability of \( \frac{\pi}{4} \) of hitting the dartboard. If you threw 100 darts and 80 of them hit the board, you would conclude that \( \frac{\pi}{4} \approx 0.8 \) and that \( \pi \approx 3.2 \). Throwing more darts should get you a better estimate — although rather slowly. If you throw \( N \) darts, the standard error of your probability is proportional to \( N^{-\frac{1}{2}} \), which means becoming half as inaccurate requires four times as many darts.
An image from Christian’s Pi Day simulation, which does exactly this experiment. 10,233 out of 13,083 “darts”, coloured blue, have landed in the quadrant while the remainder landed outside, coloured red. That gives an estimate for \( pi \) of 3.129 or so, off by about 0.013. To improve that to “off by about 0.0065”, we’d need four times as many darts — 52,000.
Holding out for a Hero
Matt famously thinks Heron’s formula is one of trigonometry’s most remarkable results. It’s been known to make Matt extremely emotional. So, naturally, my first thought was “I bet an approach based on Heron’s formula could converge more quickly.”
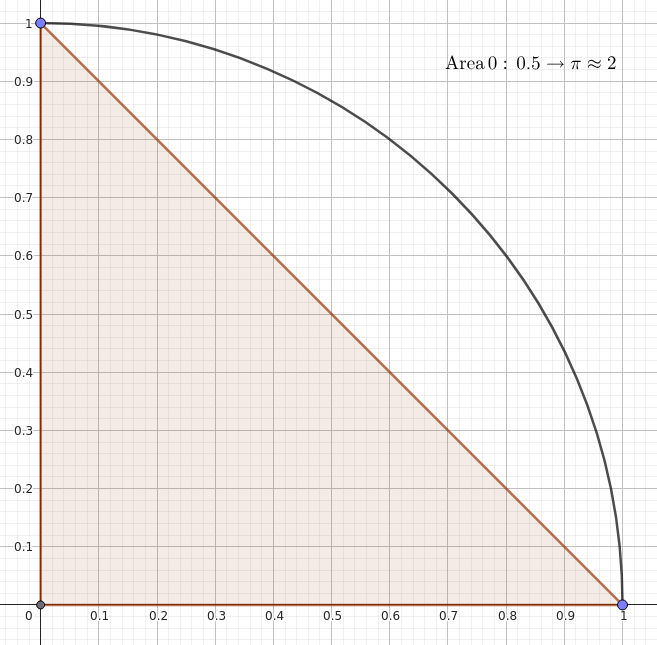
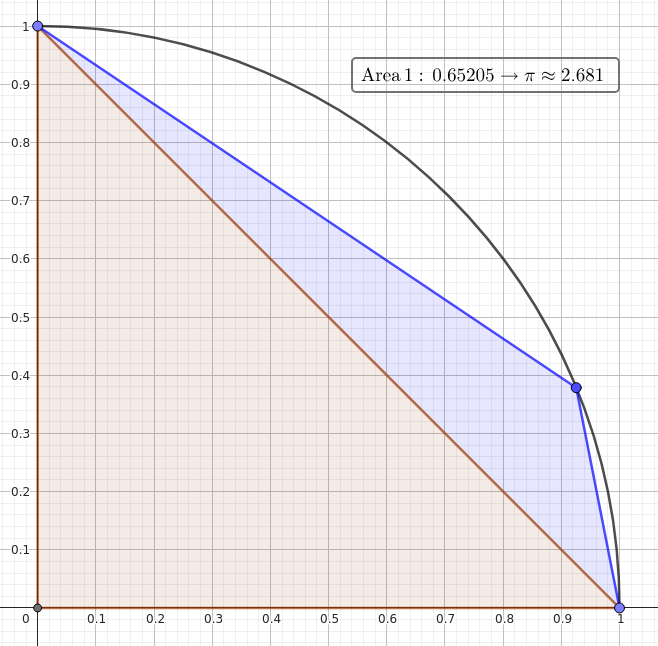
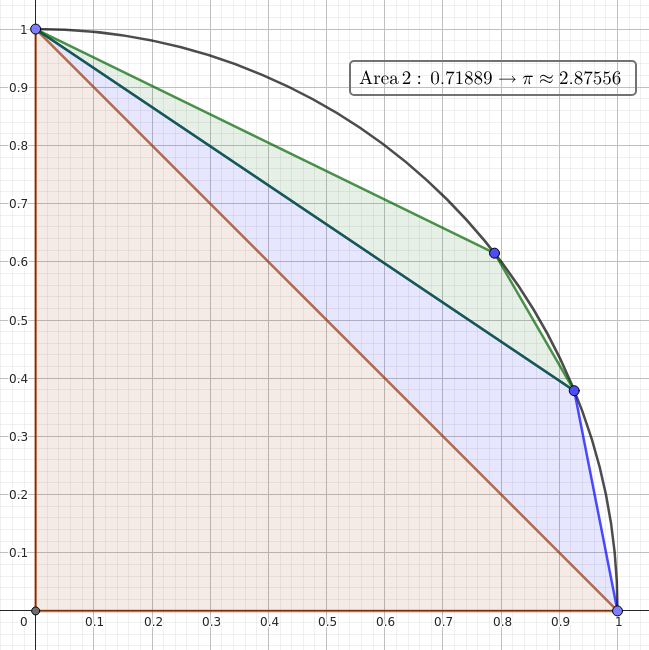
And it could! The approach entailed starting with a right-angled triangle with legs of length one inside a unit circle in the first quadrant. It would then pick a random x-coordinate between 0 and 1, figure out the corresponding point on the arc, and add a triangle based on the two adjacent points. Here’s the code. It converges to several decimal places within 10,000 iterations.
But that’s not really Monte Carlo, now, is it?
That is an excellent question, beautifully presented. I complime… what do you mean, I need to answer it? Who’s writing… OK. Fine. Sheesh.
You’re right, this isn’t a traditional Monte Carlo method. While it uses random points, it doesn’t use them to generate a probability. I do still maintain that it’s technically a Monte Carlo method, using a very involved adaptive weighting function, but I take the point.
What about proper Monte Carlo methods?
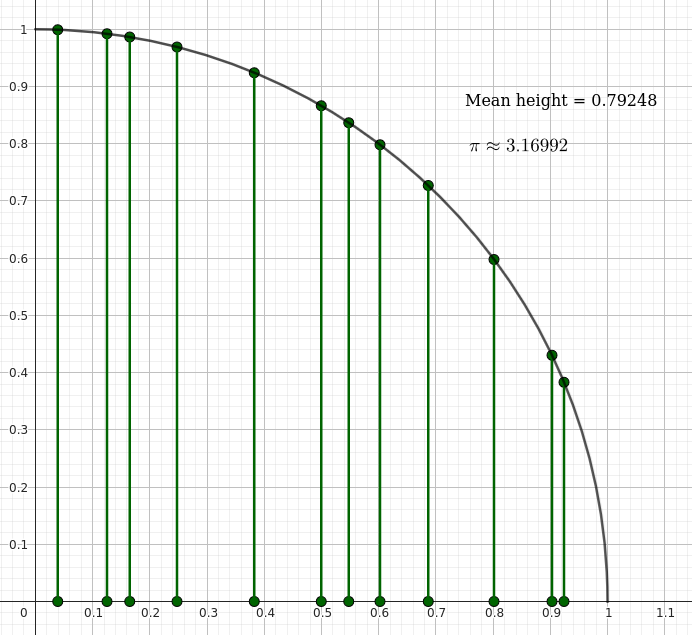
A less sophisticated (but still significantly more efficient than the integration-by-darts method) approach is to use the fact that \( x^2 + y^2 = 1 \) on the unit circle. If you pick an \( x \) value at random, you can immediately calculate the probability of a random \( y \) value giving a point inside the circle — it’s \( \sqrt{1- x^2} \). Rather than sample and add 1 or 0 to your total to approximate the probability, why not just add the probability? This converges very nicely.
The mean distance of a point on the circle from the axis is \( \frac{\pi}{4} \) — a fact we’ll (likely) be using for the actual experiment on the moon.
I’m not officially allowed to reveal that the reason for my interest in calculating \( \pi \) on the moon is that I’m helping to design Matt’s experiment, or that my codename is FizzBuzz Aldrin. (Is that lede sufficiently buried? Excellent.) And I’m definitely not officially allowed to say what we’re actually doing, because I imagine Matt will want to do a video about it.
However, I can say that the method above is equivalent to the fact that the expected distance between a point on the unit circle and an axis — any axis — is \( \frac{\pi}{4} \). By extension, using the magical incantation “SYMMETRY!” and a magisterial wave of the hand, it turns out that any point on a unit sphere is — on average — \( \frac{\pi}{4} \) from any axis of the sphere. That’s a fact that could be exploited, just to pick a random example, by a simulated rover making random moves on the surface in a sort of random moonwalk.
It would take small steps for a rover, and giant LOOPs for Matt-kind.
You can donate to Matt’s kickstarter here, if you’re so inclined. At the time of writing, they’ve raised well over a quarter of a million pounds towards their £75k target, so I’m looking forward to them launching their own space mission before long.
If you’re a teacher who wants to be involved, you can sign up here. Get the kiddos to estimate \( \pi \) by hand and they’ll get (I understand) a certificate, possibly their own value of lunar \( \pi \), and their name in a text file that goes to the moon. [Edited 2025-06-26 for formatting and to clarify that the personal \( \pi \) value is not guaranteed.]
In my childhood memories, the lanterns in my hometown always fascinated me – circular palace lanterns, polyhedral colorful lanterns. How did my ancestors achieve the magical transformation from flat to three-dimensional through simple bamboo strips and paper? As a child, I was often confused: was there anything hidden behind these beautiful shapes?
Three decades slipped by, and as I returned to the art of paper folding, that long-forgotten question suddenly became clear. It turns out that the structural principles of those traditional lanterns align with geometric calculations—how a flat sheet of paper can be perfectly transformed into a three-dimensional structure with specific curvature. This process contains profound mathematical essence: straight creases correspond to developable surfaces, while curved folds achieve their shapes. From rectangular paper-based to porcelain like smooth curved surfaces, every fold undergoes intricate geometric transformations.
This perfect fusion of craft and mathematics not only showcases the ingenuity of folk artisans but also remarkably anticipated the evolution of modern computational origami techniques. The craftsmanship behind traditional lantern-making constitutes humanity’s earliest exploration and practice of spatial geometry—a profound legacy that has continuously inspired the development of structural design approaches.
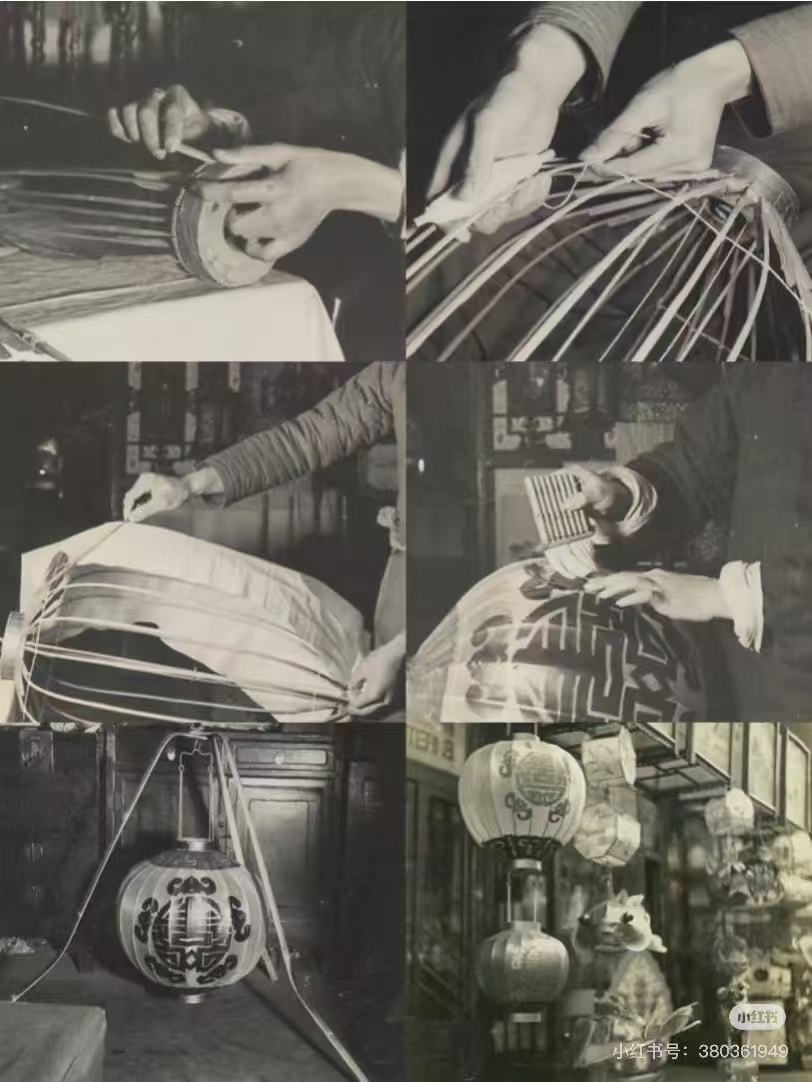
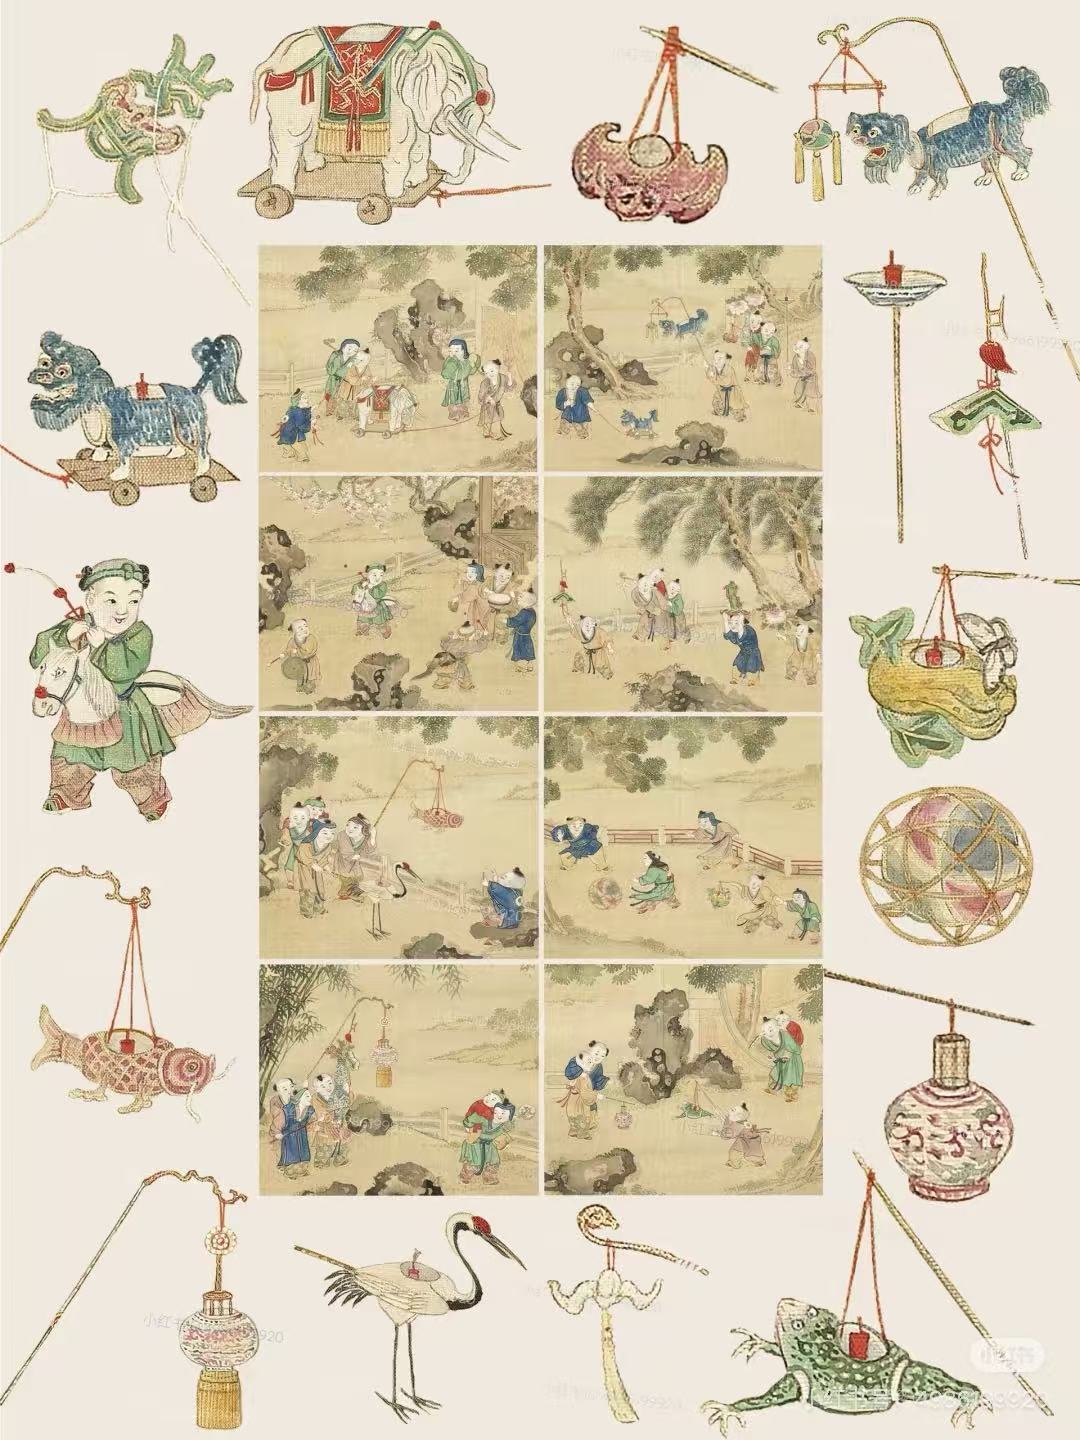
Historical photo: crafting circular lanternsAncient lantern festival: children carrying lanterns
Reflecting…
A question lingered unresolved for over three decades—until I encountered modern origami theory and finally grasped its profound mathematical wisdom. This long-delayed revelation compels me to ponder: In our relentless pursuit of so-called progress, have we overlooked something profoundly valuable? As masters worldwide have long pioneered innovations in paper folding, shouldn’t we pause and reflect? This isn’t merely an academic gap; it speaks to the neglect of foundational mathematical research. It’s time we reignite our appreciation for the enduring brilliance of mathematics!
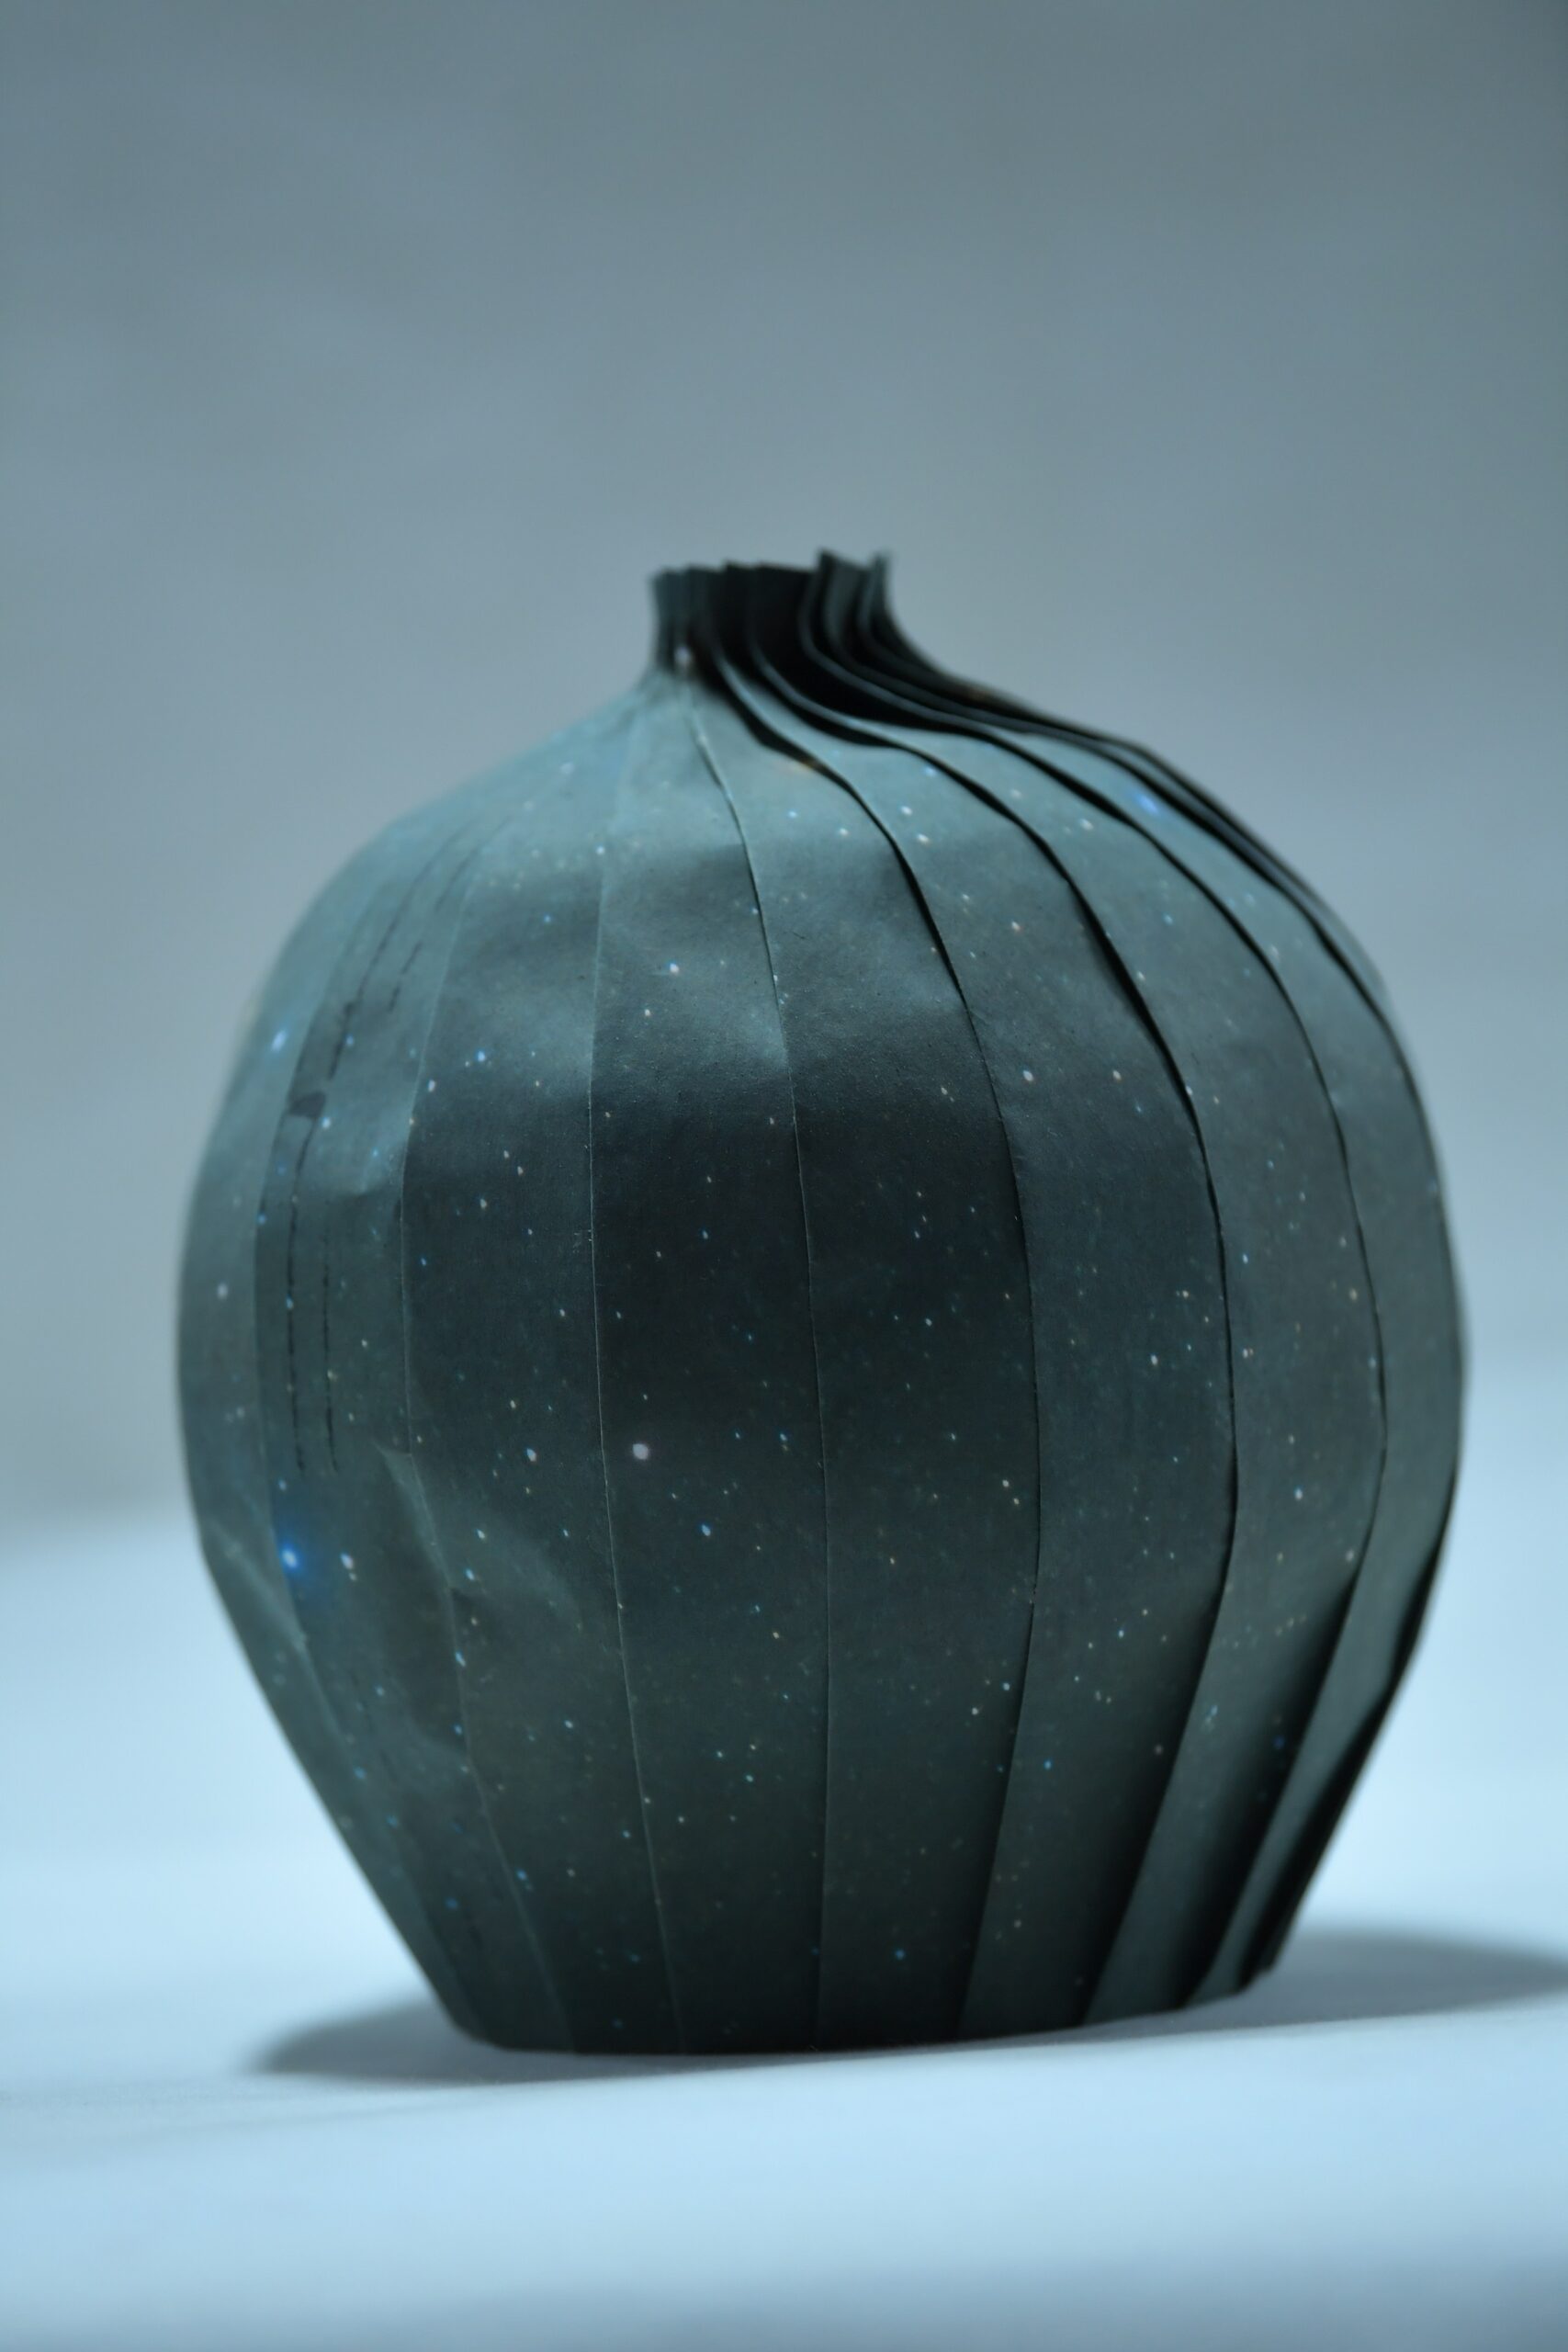
As an archetype of curved-crease origami art, Origami Blue-and-White Porcelain transforms flat paper into exquisite three-dimensional forms through precise calculated creases.
Crease algorithm design
In the art of origami creation, I have always adhered to the concept of “subtractive aesthetics” – shaping forms by accurately hiding excess parts.
This principle is particularly typical in the structure of traditional Chinese circular lanterns: When the lantern ’ s uniformly arranged petal-like segments are unfolded into a planar sheet, the absent portions represent exactly those strategically eliminated excess regions.
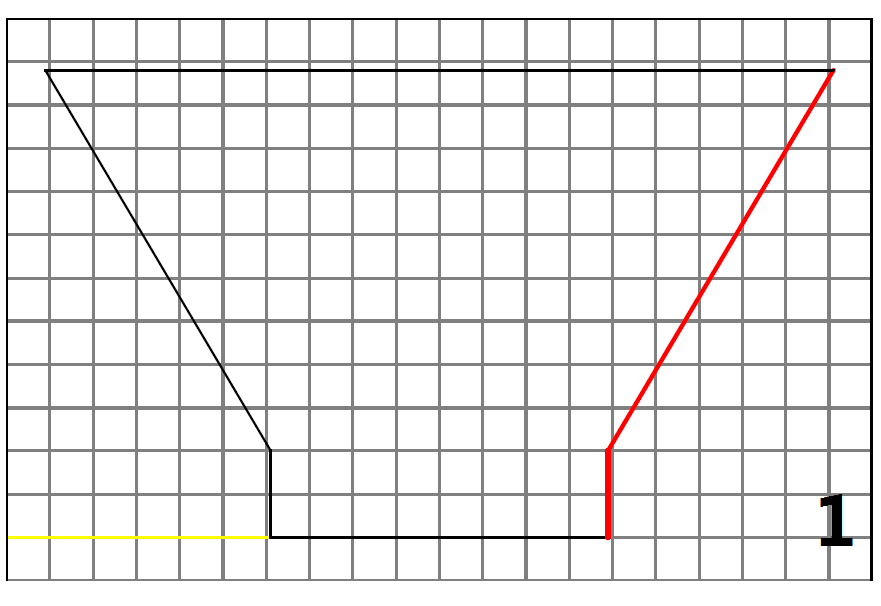
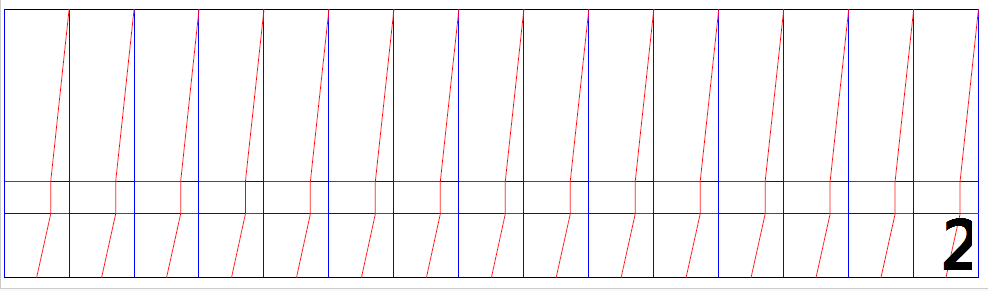
This foundational geometric principle can be extended to designing curved vessels (e.g., circular lanterns, porcelain), with its computational workflow comprising three key steps:
Unit Segment Width Determination → Based on the target model’s diameter.
Structural Length Calculation → Computed using the Pythagorean theorem.
Curved Petal Optimization → Derives optimal curvature for each unit segment.
Ultimately, the algorithm generates precise crease distribution diagrams, providing scientific mathematical guidelines for vessel fabrication.
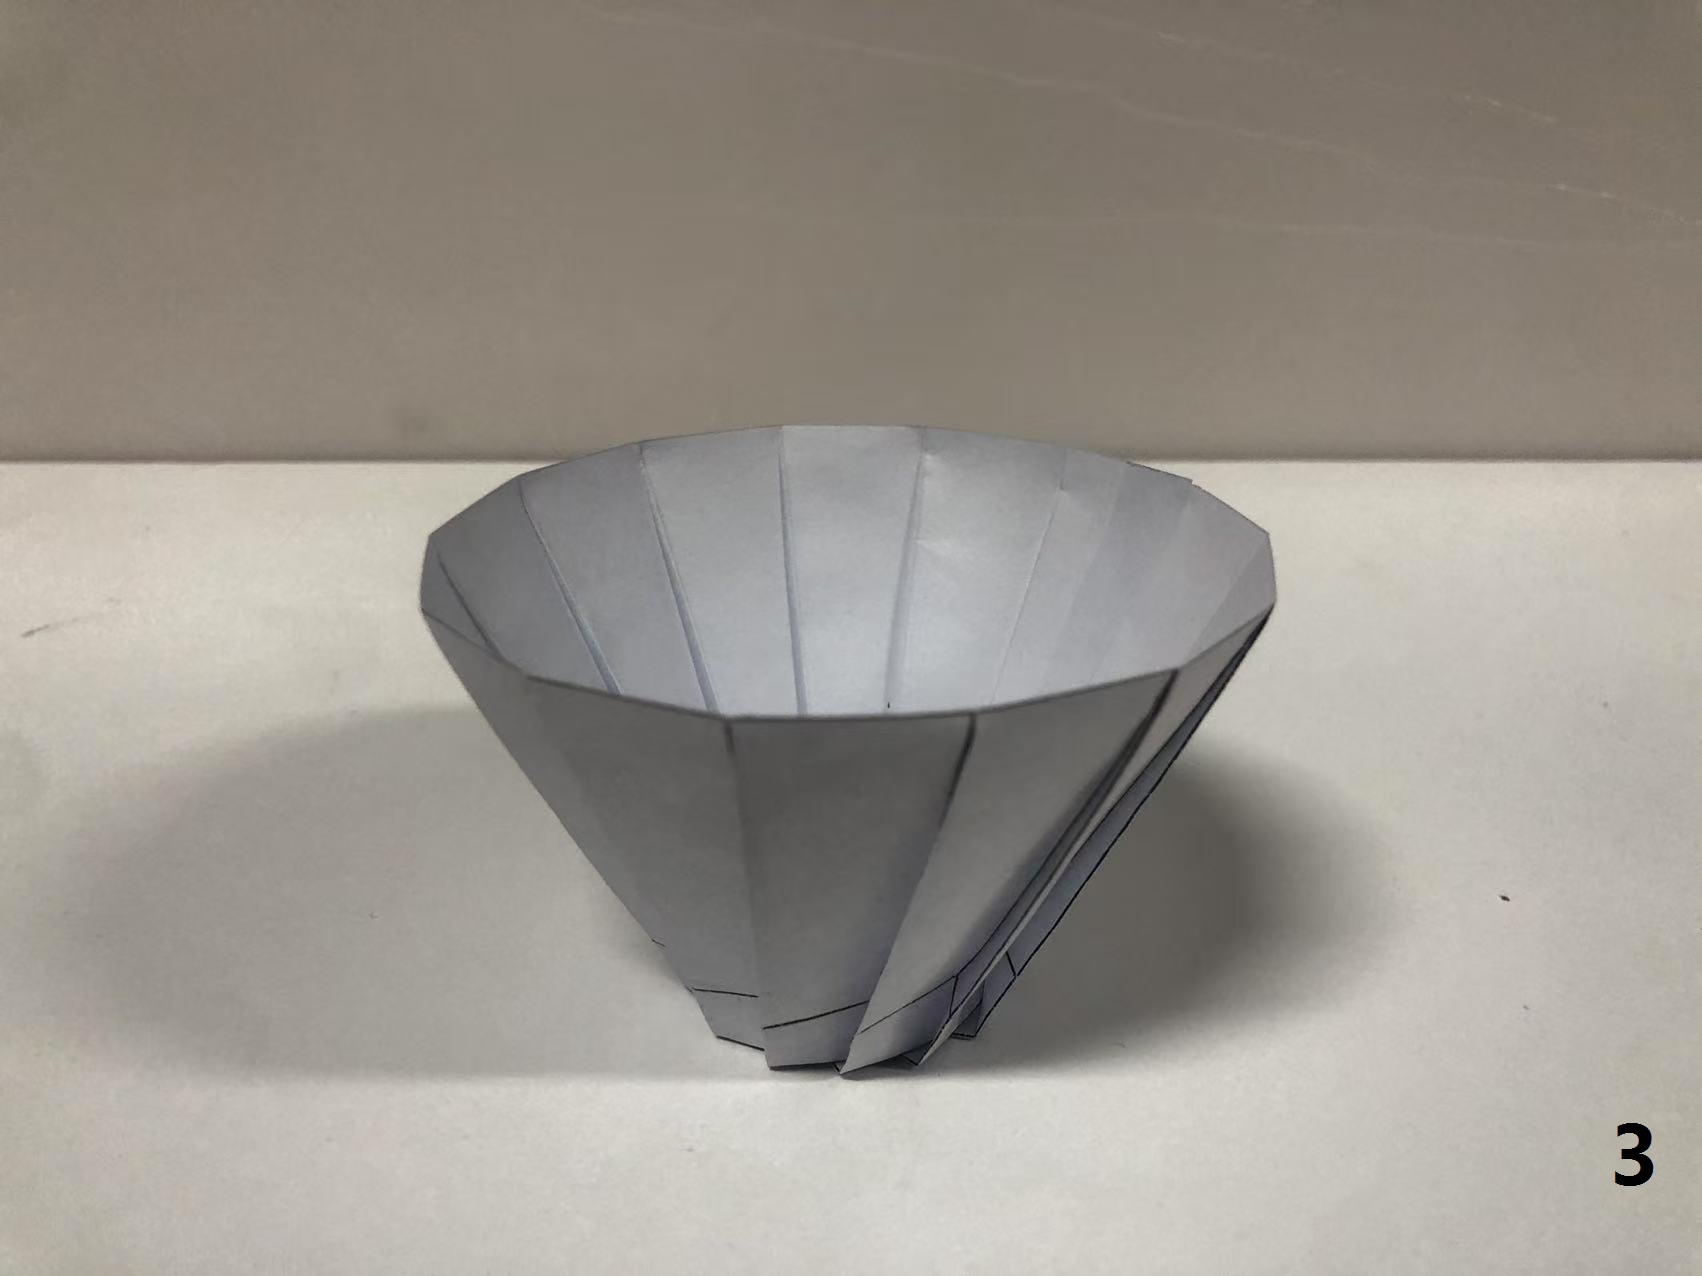
Using a bowl shape as a modelling caseCrease patternFolding form
Constructing universal geometric features
Applicable to rotatable vessels, papercraft lamps/lanterns, circular heritage architectures, and pagoda-style structures.
Engineering mathematics
This method overcomes the planar limitations of conventional origami techniques, offering an alternative computational approach for developable surface design with potential applications in industrial design and architectural mechanics.
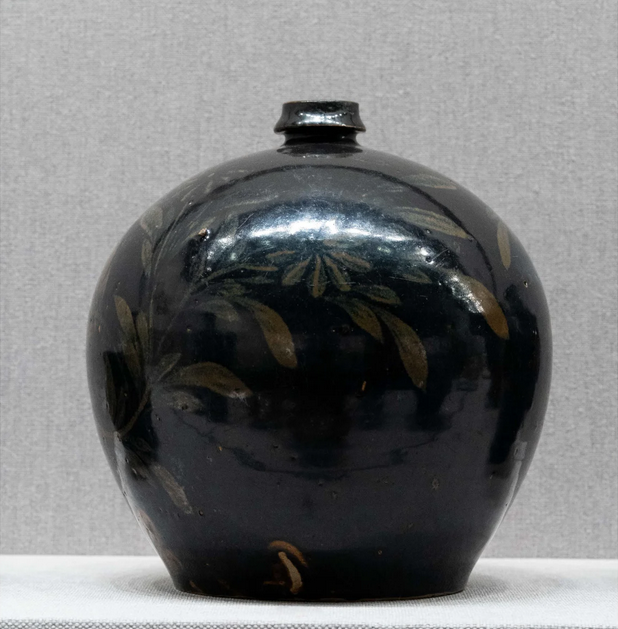
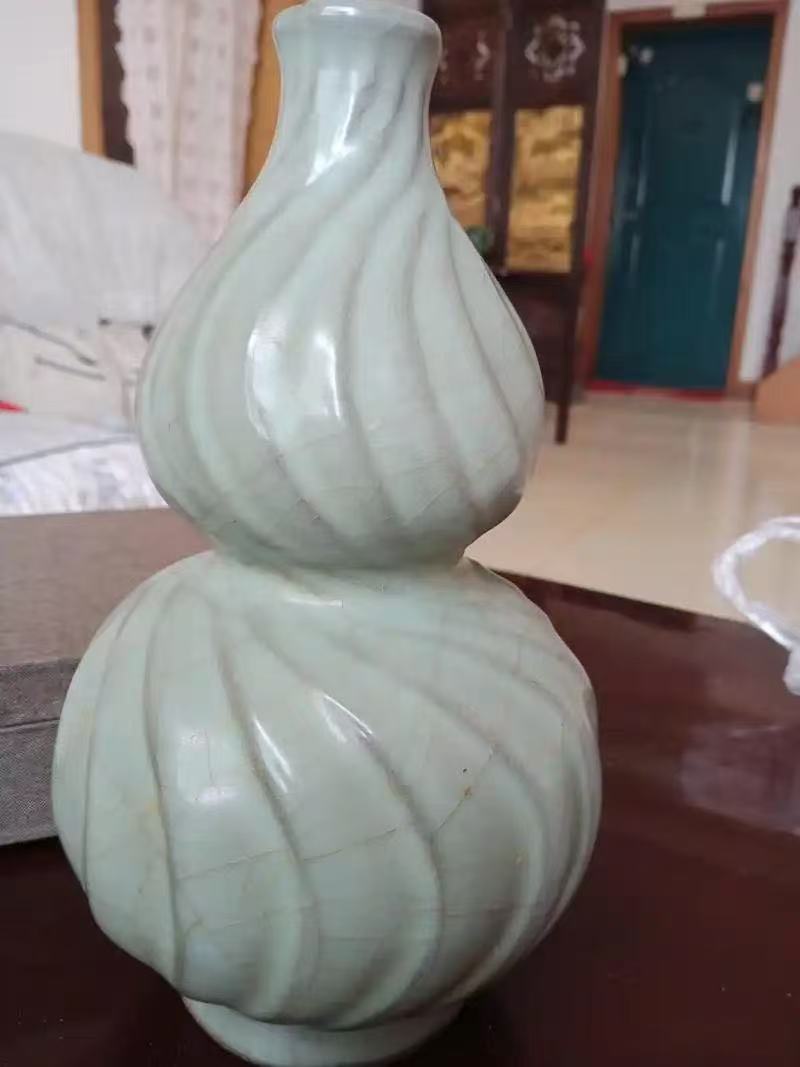
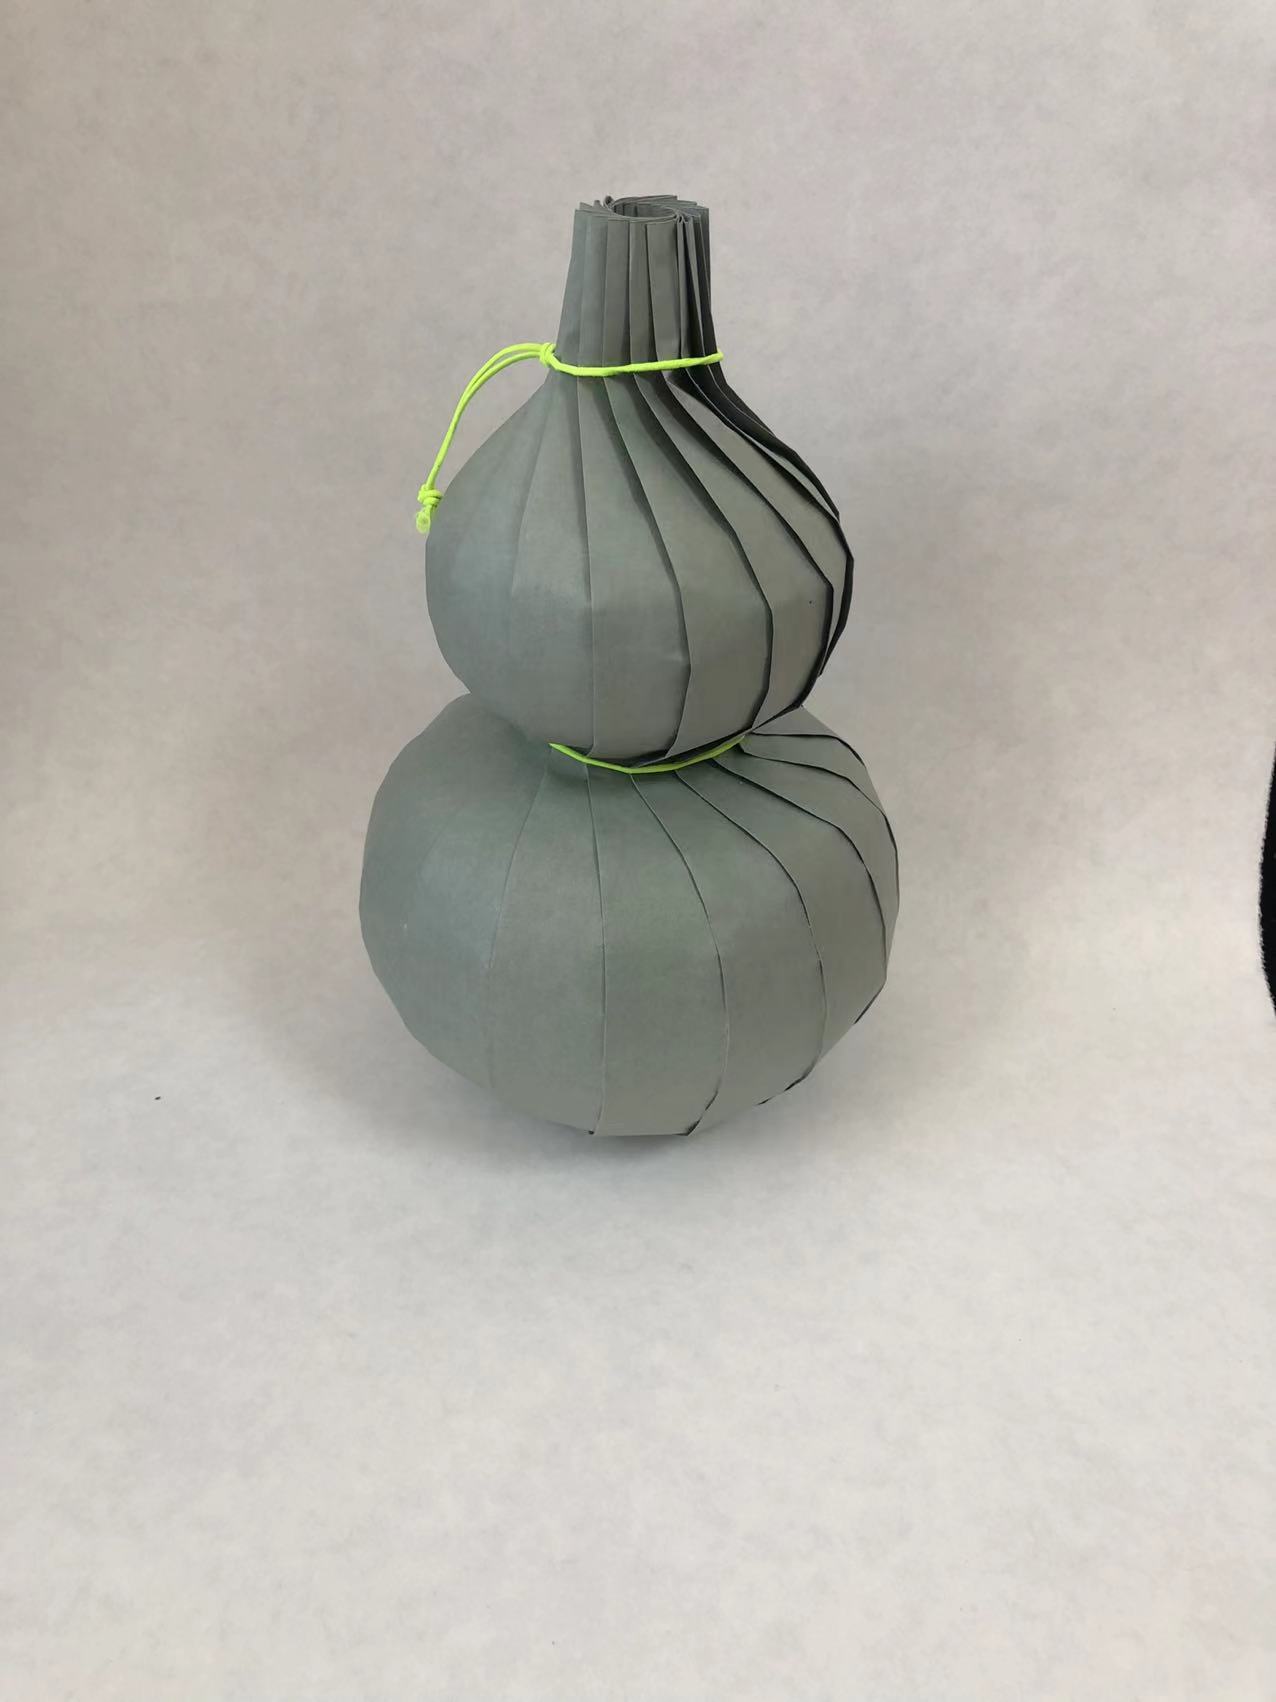
Example: Bulbous porcelain vessels (Dulu)
We observe that exquisite ceramics and traditional circular lanterns alike are formed by rotational assembly of curved crease units. This exemplifies the core principle of origami engineering: a material optimization process where precise folding conceals redundant sections to achieve visually streamlined forms.
This artifact demonstrates uniform curved crease unit distribution in its structure. The waist contour is formed through rotational constriction, showcasing exceptional craftsmanship in curvature control. Notably, its spiral patterning precision surpasses comparable paper-folding implementations.
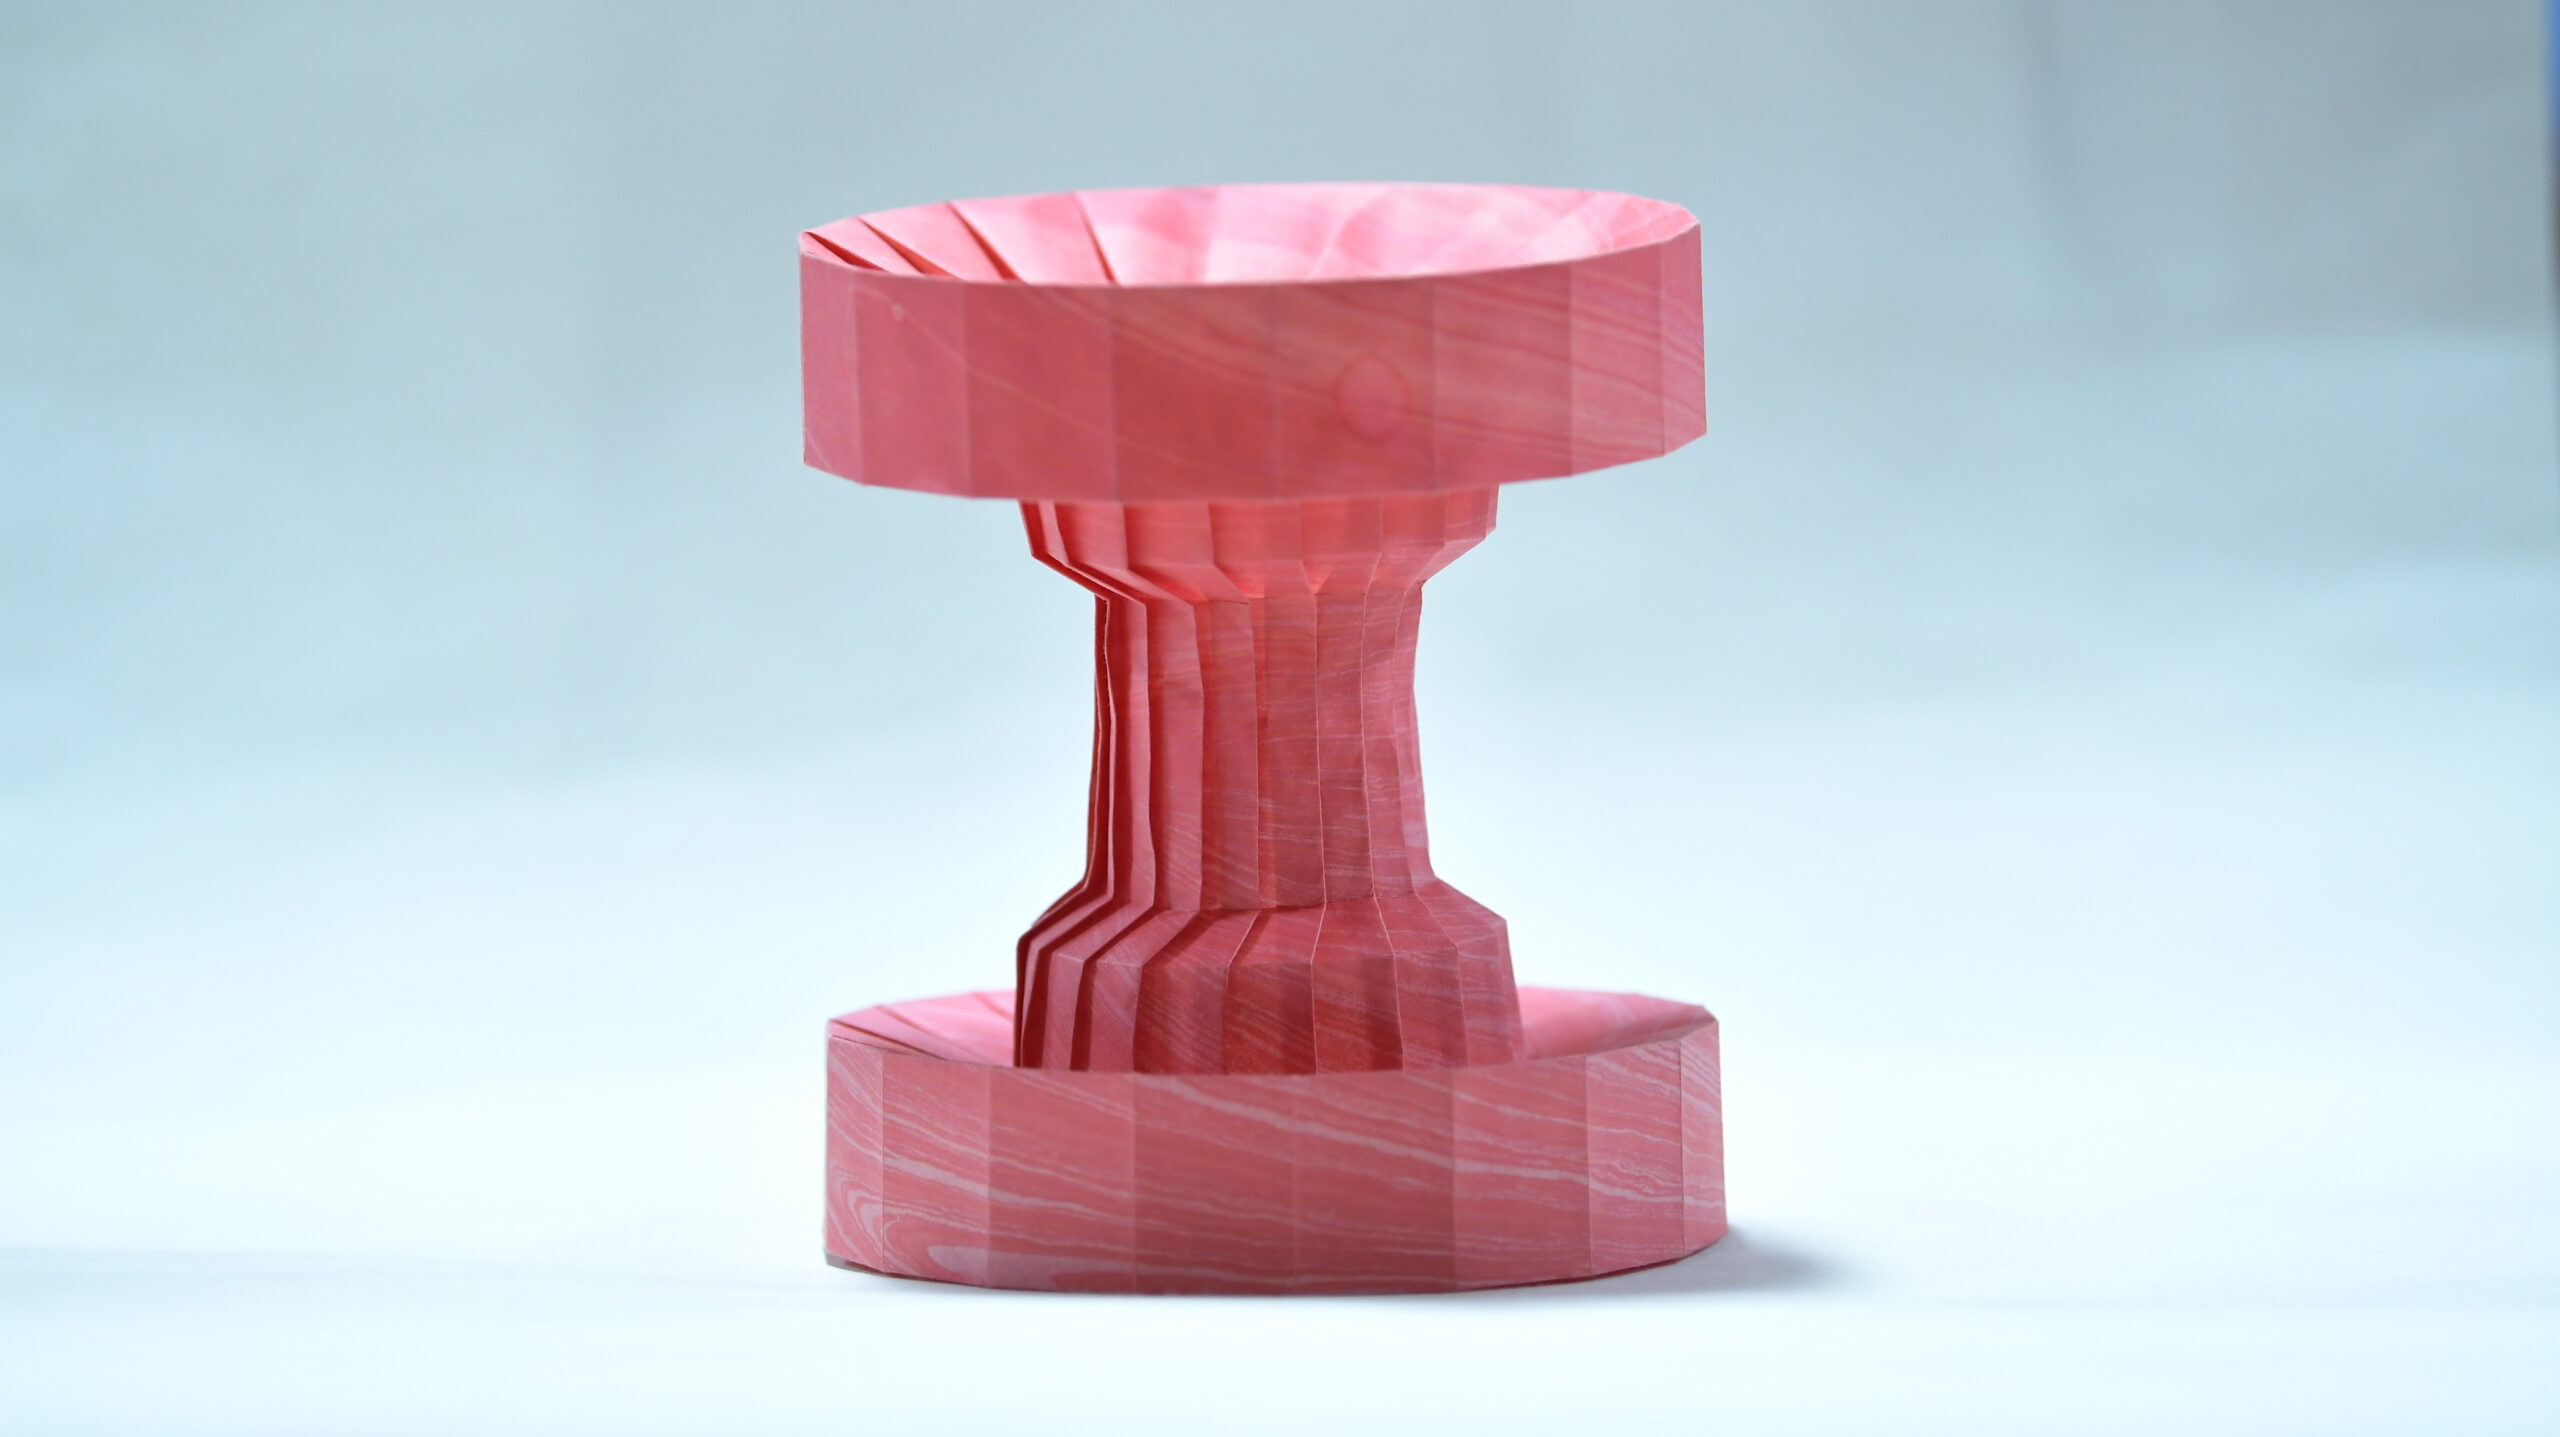
Wrong fold, it’s in another direction
These gear-like structures represent unanticipated structural outcomes during folding operations. The creative process requires continuous cognitive switching between 2D crease patterns and 3D topological realization, presenting significant neural adaptation challenges. Particularly without physical reference models, the spatial imagination ability of the brain often goes through a debugging stage, and these “wrong” works are considered a good thing from a certain perspective.
This is the mark of my encounter with mathematics. The folding and unfolding of paper is like a pair of hands revealing the science behind it. I returned to the old me, learning to discover the beauty of mathematics, exploring the mysteries of origami, and leaving my own thinking trajectory in this interlaced field.
I am the organiser of Cheltenham MathsJam, and I am a fan of our local Cheltenham Festivals. In addition to successful Jazz, Music and Literature Festivals, they have an annual Science Festival with high profile presenters, this year from 3-8 June. The Science Festival always includes some maths content, and that’s particularly strong this year.
This is a guest post by Elinor, who’s been collecting her favourite maths art from the month of March.
March is a month of change in the UK: the days get longer, the temperature is slowly creeping upwards, and we start to believe that spring may be arriving. Through this month of change I have been really enjoying all the #MathArtMarch posts that have been appearing on Mathstodon and Bluesky.
I recently read “The Warlock Effect” by Jeremy Dyson and Andy Nyman (read it – it’s good). It’s a work of fiction about a stage magician who uses his skills to combat a threat to UK national security – not somewhere you expect to find to find an interesting mathematical question.
Can humans say their largest prime number before they find the next one? After the discovery of the new Mersenne Prime, a community project aims to find out!