This is a guest post by semi-regular guest author, mathematician-turned-maths-teacher Andrew Stacey.
I like having something mathematical to think about for times when I’m, for example, waiting in a queue to get into the supermarket. Annie Perkin’s Math Art Challenge has been a good source of such of late. These are a series of mathematically-inspired artistic activities, ranging from designing celtic knots to constructing origami polyhedra and everything in between.
My eye was caught by one on sandpiles – I’ll explain exactly what they are in a moment. One feature that made it attractive was that it was quite simple to write a program to generate diagrams. I find that the maths that interests me usually comes from looking at variations, and for that I need to generate a lot of examples. Doing them by hand quickly becomes laborious. So I whipped up a program (which I later converted to an online version) and ran it a few times to see what happened.
Sandpiles
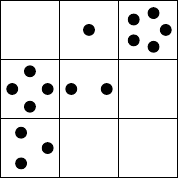
The basic idea of sandpiles is straightforward. We have a network of cells, say a grid of squares, and in each is some quantity of sand grains. Any cell with as many grains as neighbours is unstable and can topple one grain to each of its neighbours. So in a square grid, a cell with four grains will topple one grain to each of its neighbouring squares.
On a finite grid we need to worry about cells on the boundary – and one thing I’ve learnt to do over the years with anything on a grid is to pay particular attention to the boundaries. There are several possibilities of which I considered the following:
- Grains fall off the grid.
- Grains that would fall off stay where they are.
- Grains that would fall off reappear somewhere else – and where that is depends on some choice. Simplest way is to match opposite sides to get a torus, or to match with a twist to get a Klein bottle or projective plane.
In all cases I found some interesting patterns. For this post I’m going to focus on the torus, where grains falling off one edge reappear on the corresponding cell on the opposite edge.
One other thing is important to say: after playing around with this, I went looking at a bit of the literature and discovered that I’d misinterpreted one key aspect of the sandpile system. That misinterpretation is actually crucial to the patterns I found so I’ve kept it but it does mean that this differs slightly to the direction that the literature on sandpiles has taken.
In the literature, a transition is a single pile toppling. At each step there is free choice as to which unstable pile will topple. My misconception was to assume that a single step consists of every currently unstable pile toppling.
On an infinite grid, or one where grains can fall off, this isn’t an important distinction. Piles continue to topple until they all become stable and their order of toppling doesn’t affect its final state.
On a finite grid with no “sink”, however, it is possible that there is no final state. My misconception, though, does mean that there can be periodicity since there is no choice involved at each step.
In fact, periodicity is inevitable.
Building a Sandpile
Let’s define our terms. We’ll start with a rectangular grid with $m$ rows and $n$ columns. We’ll refer to the entries of the grid as cells, each cell contains a number of grains of sand, so we have an $m$ by $n$ matrix of positive integers (zero is positive here).
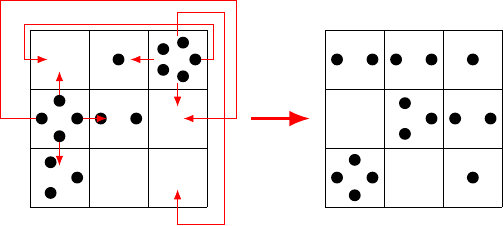
At each stage any cell with at least four grains donates one grain to each of its four immediate neighbours, with the understanding that each cell on the top row is neighbour to the corresponding cell on the bottom, and similarly for the sides. So our cells can be thought of as being written on a torus (or doughnut).


What I am interested in is the long term behaviour from some initial configuration. The simplest initial state is a stack of grains in a single cell. This gives two directions to investigate: the size of the original stack and the size of the grid. Note that due to the wrap-around, the choice of where the initial cell lies is immaterial. For convenience in programming I chose the cell at position $(1,1)$ (the top left corner).
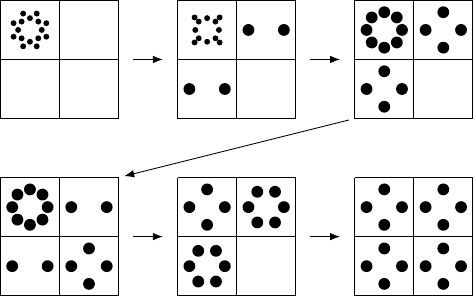
So an example on a $2 \times 2$ grid would be in the figure below, which eventually stabilises. After the sixth step then each pile continues to topple at each turn, but gains as many as it loses so the overall pattern is stable.

Initial Results
I wrote a program to play around with this and quickly noticed a few things. Every starting configuration led to a periodic system (in which I include static systems). This is not hard to prove: as we never lose grains, at each step we visit one of the possible allocations of that number of grains on that size grid. There are only a finite number of such so eventually we land on one we’ve visited before. At that point we are doomed to repeat ourselves: we are trapped in a loop. Or stuck where we are.
What was more interesting was that for a fixed grid size there seemed to be a range of starting values which led to a genuinely periodic solution, and it was static either side of this range.
At this point I used my program to find the upper and lower limits of these ranges for square grids, put them in OEIS, and turned up … nothing. Which is quite exciting! So I carried on investigating.
Here’s what I have so far.
Theorem Consider a toroidal sandpile of size $m$ by $n$ with an initial pile of size $k$ on one cell. Then the set of initial sizes $k$ such that the eventual behaviour is truly periodical is non-empty and bounded. Let $a_{m n}$ and $b_{m n}$ be, respectively, the least and greatest starting values that lead to truly periodical behaviour then these satisfy the inequalities $a_{m n} \le 3 m n + 1$ and $4 m n \le b_{m n} \le 7 m n$.
Conjecture With the above notation, if $a_{m n} \le k \le b_{m n}$ then the long term behaviour is truly periodic. All periods are even, and any even number is a period for some $(m,n)$.
What the theorem says is that the periodic part occurs in a bounded range. Above and below this we get static long term behaviour. The conjecture says that the periodic part is a contiguous range.
A little computer programming produced the following table of values for the $a_{m,n}$ and $b_{m,n}$ (using the obvious symmetry to save on calculations).
$$\begin{matrix} ( 0, 0) & \\ ( 6, 7) & ( 8, 15) & \\ ( 10, 11) & ( 14, 25) & ( 24, 35) & \\ ( 12, 15) & ( 16, 33) & ( 32, 55) & ( 40, 67) & \\ ( 16, 19) & ( 24, 45) & ( 42, 63) & ( 48, 89) & ( 60, 99) & \\ ( 18, 23) & ( 30, 55) & ( 44, 81) & ( 58, 115) & ( 68, 135) & ( 72, 159) & \\ ( 22, 27) & ( 38, 61) & ( 52, 91) & ( 62, 127) & ( 84, 161) & ( 100, 185) & ( 116, 219) & \\ ( 24, 31) & ( 42, 67) & ( 60, 103) & ( 70, 149) & ( 102, 181) & ( 118, 223) & ( 130, 261) & ( 132, 291) & \\ ( 28, 35) & ( 48, 79) & ( 70, 109) & ( 96, 165) & ( 110, 203) & ( 124, 241) & ( 152, 283) & ( 162, 347) & ( 204, 367) & \\ ( 30, 39) & ( 50, 89) & ( 78, 127) & ( 98, 181) & ( 124, 231) & ( 134, 289) & ( 166, 313) & ( 168, 383) & ( 212, 409) & ( 216, 463) & \\ \end{matrix}$$
Proving the Theorem
The crucial step to proving the theorem is to look at what can happen in a transition.
Lemma If a cell has four or more grains, at the next stage it has the same or fewer. If a cell has three or fewer grains, at the next stage it has the same or more.
Proof At each stage, it gains grains from any of its neighbours with four or more grains. As it has four neighbours, it can gain at most four grains. If it has four or more itself, it loses four grains. So if it has four or more, its net change is to lose anywhere from none to four. If it has three or fewer, it doesn’t lose any so its net change is to increase by somewhere between none or four.
Corollary If a cell has seven or fewer grains at some stage, it never rises above seven again.
With that established, we look at what goes on in a long term pattern.
Proposition In a long term pattern, if a single cell’s value doesn’t change then the whole pattern is static.
Proof There are two cases: the cell is stable (at most three grains) or unstable (at least four).
If unstable, it loses four grains each transition so it must also gain four each time. This means that each of its neighbours must topple each turn so must have four or more in each state. As the pattern is periodic, if one of those cells strictly decreases then it must later increase back to its earlier value. This can only happen if it drops below four meaning that there is a step at which it doesn’t topple. As our original cell doesn’t change, this means that there can’t be such a step and so the neighbouring cells must also have fixed value at least four.
A similar argument holds for a cell with a fixed value of three or fewer since then it can’t gain so its neighbours must stay at three or fewer and so also have a fixed value.
Corollary If a sandpile on a grid of size $m,n$ has a starting pile of size $7 m n + 1$ then its long term behaviour is fixed.
Proof Consider a configuration in the long term behaviour. Each cell that starts empty can have at most seven grains in it, so as there are $7 m n + 1$ overall, the starting cell must have at least eight grains in it. As this is true for all the configurations in the long term behaviour, it must be fixed. So all the cells must be of fixed size.
Corollary If a sandpile of size $m,n$ has a starting pile of size $k$ with $3 m n + 1 \le k \le 4 m n – 1$ then it is periodic.
Proof To have fixed long term behaviour either every cell has at most three or every cell has at least four.
This then establishes the theorem.
One last result is worth recording here. If a starting configuration of size $k$ leads to a fixed state and the initial cell never drops below $3$, then every larger starting pile also leads to a fixed state.
This is because to reach a fixed state every cell must end up with at least four grains. If we track the two sandpiles, as the initial pile in the smaller never dips below four, the larger is always the same as the smaller but with one more grain in the initial cell. So when the smaller reaches a state where every cell has at least four, so does the larger.
Final Remarks
There are lots of directions one could take with this. As well as figuring out the conjecture, there are also questions relating to how long a sandpile takes to get to its eventual state. Then there are other starting conditions and other graphs. Even just a circular ring of cells proves intriguing with different behaviour depending on whether there are an even or odd number of cells.
Indeed, the theorem itself generalises. Given a finite graph, $G$, with $e$ number of edges and $v$ number of vertices and with $a_{G}$ and $b_{G}$ being the lower and upper limits on true periodicity then the same argument that established the theorem shows that we have $a_{G} \le 2e – v + 1$ and $2e \le b_{G} \le 4e – v$.
It is important to emphasise again that this investigation has diverged slightly from that in the literature. While interesting, one thing bothers me about this: it no longer feels like sand because it is possible to have a situation in which one cell contains a large number of grains compared to its neighbours and yet the number of grains it contains stays constant. So instead of piles of sand grains, I find myself thinking more in terms of atoms. Because of how the electron shells work, the overall number of electrons round an atom isn’t important: it is only the number in the outermost shell that can be accessed. So rather than each cell being a pile of sand grains, I picture it instead as an atom and the number of neighbours is the number of electrons in each shell. While not realistic, it still feels more suitable than the sand picture.
However, this does mean that I should be writing about toppling unstable atomic piles and somehow I find myself reluctant to put that into a search engine. Still, I used to study fusion in nuclear spaces so maybe this is the next logical step in my research.