In which the intrepid maths-crime-fighting duo of Gale and Beveridge find themselves thrust back to a time before people could do maths properly.
It had been a quiet night at the Aperiodical police station. Apart from a few cases of broken scheduling in Excel formulas – nothing a bit of TIME() in the cells wouldn’t put right – there was nothing.
At 11pm, the phone rang. I looked at Sergeant Gale. Sergeant Gale pointedly looked at the phone, raised an eyebrow, and returned to his sudoku.
“Maths Police, bad graphs department. Constable Beveridge speaking, how can I help?”
It was one of our top informants, Sparks. He’d been in trouble before for maths busking after hours, but he was clean these days. Respectable job, occasional haircuts. “You might want to check this out,” he said, reeling off a link.
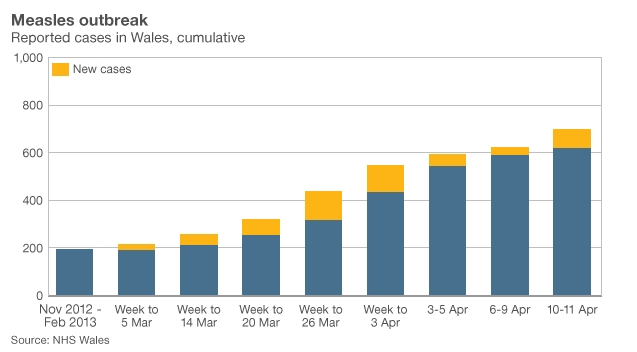
The case of the measly increase
“Good god,” I said, in a panicked-enough tone for Gale to put the puzzle book down and look at the screen.
“That doesn’t look so…” he started. Then stopped.
“Exactly,” I said. “This is bad news.”
It looked reasonable enough, at first glance: a surge around mid-March, but starting to flatten off. Move along, nothing to see.
But then you look at the time scale: you can’t get away with that sort of thing these days. The first bar covers four months. The last bar – the same size – covers two days.
“It’s the wrong sort of graph, too,” noted Gale. “A line graph would be much better.”
“They ought to link to the data, too. And give a proper key.”
“They’re looking at five to ten for this,” said Gale. “Book ’em, Statto. Incompetence one.”
The case of the broken arrows
We’d barely finished processing the whole of the BBC ((you can’t be too careful)), when our colleague Witkoviak brought in a cold case.
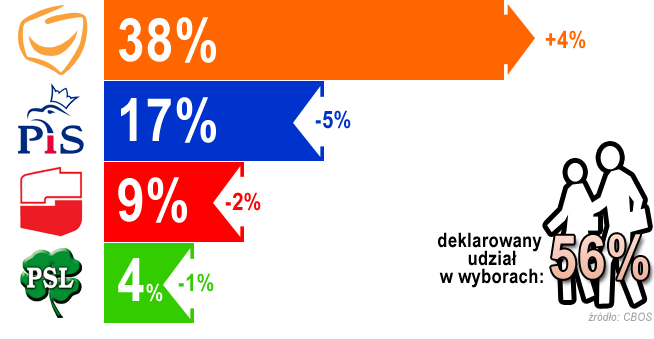
“It’s from a Polish election.”
“Wow,” said Gale. “Dirty stuff.”
“Mhm,” said Witkoviak. “As you can see, the numbers add up to 68%.”
Gale immediately put out an all-points bulletin. “We’ve got an urgent case of missing data. 32% of the Polish electorate are missing, presumed disenfranchised. This is not a drill.” He held up a screwdriver. “I repeat, this is not a drill.”
“And the 56% is turnout? This just doesn’t add up. What happened to the other 18%?”
“More to the point,” continued Witkoviak, “the arrows make the bars look longer and shorter – the illusion is especially strong for PSL, which looks even less popular.”
“It’s from a reputable polling agency,” I said.
“It’s not clear whether CBOS did the graph, though,” said Gale, “it could just as easily have been the news organisation.”
“These axes… notice anything?”
“They’re at 90 degrees?”
“Yes. They’re at right angles. We’ve got our perp.”
He sighed. “It’s going to get cosy in the cells tonight, isn’t it? Still, duplicity is duplicity.”
The case of the unordered list
“What,” said D.I. Rowlett, without so much as an ello ello ello, “is all going on ‘ere?”
“Evening, sir,” said Gale. “I thought you were on sabbatical?”
“You can try to take a sabbatical,” said Rowlett, “but they always pull you back in for one last case. Take a look at this!”
“But, sir,” I protested. “We’ve already got half of the Polish media and the BBC locked up…”
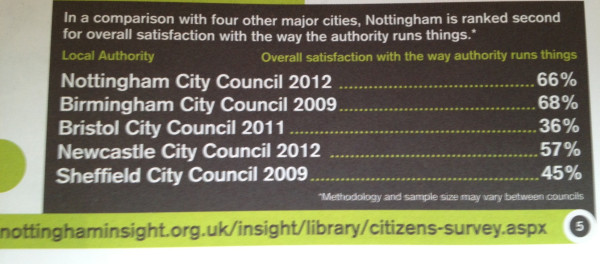
A stern look from Rowlett shut me up. “You know perfectly well we have an infinite number of cells. Move everyone in cell $n$ into cell $2n$ if you have to, but Nottingham City Council is going down for a very long time.”
What the D.I. says, goes. And you can’t have councils putting lists out of order willy-nilly, now, can you? Or picking random cities to compare with. Or, for that matter, comparing results from different methodologies.
I sighed, and freed up enough cells for Nottingham City Council as well. The paperwork alone was going to keep me here until the next election.
The case of the ballot of Boot Hill
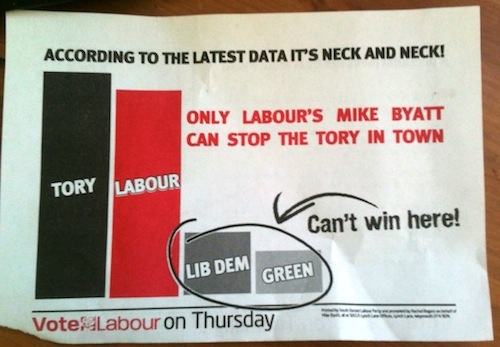
“Talking of elections, this one’s from my neck of the woods,” I said. “And it’s shenanigans of the highest order.”
“Shenanigans is such an ugly word,” said Gale. “It could just be an honest mistake.”
“It’s the Labour Party,” I said. “Mistake, yes, plausibly. Honest? Look at it. There’s no scale on the axis. There’s no source for the data. There’s no…”
“Well… we could at least ask them where the data comes from.”
“Good idea.” I grabbed my trusty raincoat and gumshoes, and tracked down the South Dorset Labour Party hidden away on their facebook page, brazening the whole thing out:
“That’s as good as a confession!” I said. “Bang them up! We couldn’t get them for the Iraq war dossier, but…”
“Due process,” said Gale, patiently. “You could at least ask again.”
“Fine!” I said.
“No,” said Gale, “a fine would be completely inadequate, if you’re right.”
I got hold of Councillor Dan Brember on Twitter, who insisted it was all above-board – the data was not at all misleading, and came from Comres polling.
@icecolbeveridge @winterborne74 And nothing misleading about the graph. See comres polling of South West county authorities dated 30/4.
— Dan Brember (@dbremz) May 5, 2013
We got out our hard-stats-hats and went data-mining. Gale, eventually, had the Jeremy Kyle moment. “This graph is made up. The closest thing is the nationwide data, but the conclusion ‘can’t win here’ is a complete non-sequitur. Plus, they’ve missed out UKIP.” Brember, confronted with this evidence, eventually confessed. Case closed.
@icecolbeveridgeI’m nothing if not willing to hold my hands up – I was wrong!
— Dan Brember (@dbremz) May 8, 2013
The case of the housing pie
@aaronjohnpeters Refer you again to this. (source: Shelter). twitter.com/SteveAkehurst/…
— Steve Akehurst (@SteveAkehurst) May 6, 2013
“Isn’t it knocking-off time yet?” asked Gale, whose sudoku was sitting unsolved on the table. It wasn’t the only unsolved thing.
“Just time for one more,” I said. “And it’s Owen Jones.”
“The Owen Jones?”
“The Owen Jones.”
“Never heard of him.”
“Inexplicably popular hard-left columnist. And I want to frame him for this monstrosity,” I said.
“Oh, that Owen Jones. In fairness to the lad, it’s Steve Akehurst’s picture. Let’s have a look. Nothing wrong with… wait, why does he have empty houses and housing needed in the same pie chart?”
“More to the point, why hasn’t he just used Shelter’s original graph (Figure 3), which makes the point much more clearly and correctly?”
“Hard to say,” said Gale. “We’d better put him in a cell with a complicated graph and throw away the key.”
“It’s the only language he understands,” I said.
We looked at the camera, and the credits rolled.


