Two months ago, I bought isthisprime.com and not only set up the internet’s fanciest primality-checking service, but also invented a rather addictive game.
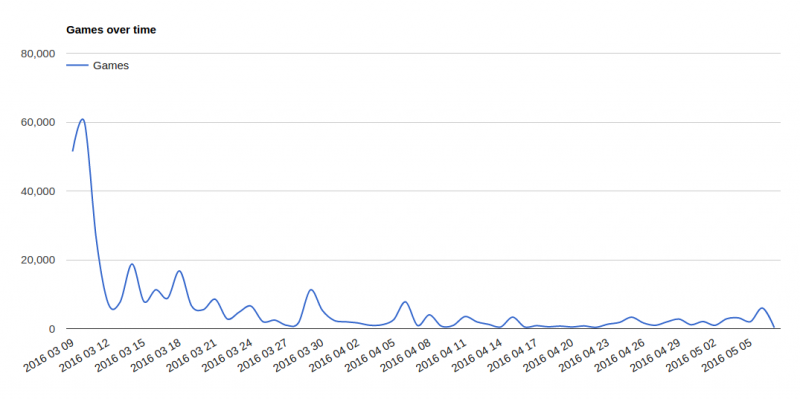
It quite quickly went viral, or as relatively viral as a maths game can get, with people tweeting their high scores and posting the link to reddit and Hacker News. I realised fairly soon that I should put in some stats tracking, to see if there were any interesting patterns in the data (and also to inflate my ego as the “games played” counter went up). I missed the first big spike in traffic, but on the 9th of March I wrote a script which saved a record of each game to a database.
The mad rush settled down quite quickly but there were still occasional spikes as different sites or people with lots of twitter followers found the game. Now, after two months, I’ve got data for just under 350,000 games. That’s a decent amount of information!
I recorded the time the game finished, the sequence of numbers the player correctly sorted, the number they failed on, and the reason the game ended (thought composite was prime, thought prime was composite, ran out of time).
Unfortunately, I’m not a statistician, so I can only do ham-fisted analysis of this rather large data set. That’s never stopped me before, though! A good thing about having this much data is that I probably don’t need to worry too much about error bars, as long as I stick to broad generalisations.
The first question I wanted the answer to was: does everyone else think 57 is prime, or was it just Grothendieck?
To answer that, I computed the numbers which people most often sorted incorrectly.
| Final number | Reason for ending | Frequency | % of games | $\Pr(\text{fail} \mid n \text{ shown})$ |
|---|---|---|---|---|
| 51 | composite | 20314 | 5.85% | 39.5% |
| 57 | composite | 19201 | 5.53% | 34.6% |
| 39 | composite | 14169 | 4.08% | 24.9% |
| 1 | composite | 11976 | 3.45% | 23.8% |
| 87 | composite | 9024 | 2.6% | 30.3% |
| 59 | prime | 9006 | 2.6% | 17.8% |
| 5 | prime | 8606 | 2.48% | 16.9% |
| 63 | composite | 8418 | 2.43% | 16.3% |
| 33 | composite | 8361 | 2.41% | 15.6% |
| 91 | composite | 8241 | 2.37% | 29.3% |
Interestingly, it seems that 51 looks even more prime-like than 57! It’s possible that the Grothendieck prime urban legend has made more people aware of 57’s non-primality, while 51 slips under the radar.
There are a couple of other interesting entries in the table above: a worrying number of people think 39 is prime (fair play, numbers ending in 9 are often prime[citation needed]), and the prime most often labelled as composite is 59 – people really struggle with the 50s.
When I introduced the game, I flippantly said that the computer had had its go and now it’s your turn to decide whether numbers are prime or not. Luckily, there’s no number that more people get wrong than right – collectively, you got every one right. Great job! 👍
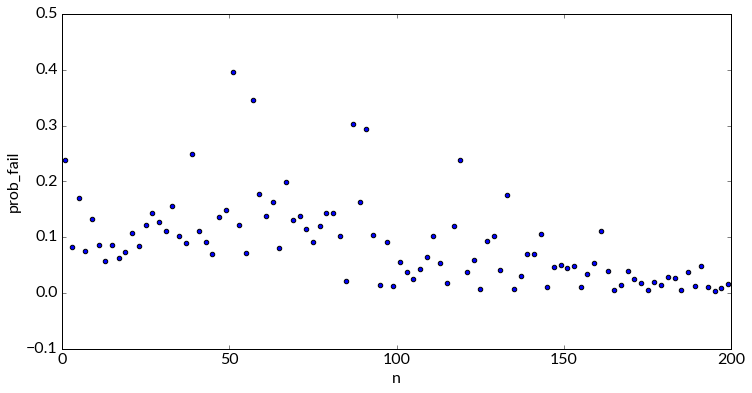
As the numbers increase, it becomes less likely that players will misidentify them. That suggests that once you get past 100, the time limit and panic are your only enemies.
There are some clear outliers in the graph above, which I’ll say qualify for “Grothendieckyness”. They are 51, 57, 87, 91, 119, 133, and 161. 133 is my personal nemesis – of course it’s a multiple of 7 once I’ve taken a moment to think about it, but it does look very prime otherwise.
So the data have already given me a couple of surprises. Next, I thought I’d look at the distribution of scores as a whole. Here’s a plot of scores against length of game, in seconds:
There are some clear lines that can only be tool-assisted games! There’s a load of noise at time=60 and high score, which I think must be more cheaters.
The other lines represent particular rates of scoring. The lines that shoot out above the main mass of points must be cheaters – or strategies that don’t involve much thinking, at least.
Each point on these high-gradient lines represents a game ending because of an incorrect decision: most of these cheating runs end by getting a question wrong instead of running out of time. Who’s this bad at cheating?
To investigate: what does the distribution of scores of a strategy that picks at random look like?
Anyway, it looks like no, or very few, humans get over 100, so let’s restrict the plot.
Games which end because the player runs out of time make up that thick line at time=60. The line thickens at the bottom because of people who abandon a game partway through, I suppose.
However, there’s a big thick line at score=26. How odd! One explanation could be that that’s when people get a mental block, but you’d expect to see higher frequency at nearby scores too if that was the case. I have to conclude someone did this deliberately. If that was you – why?
Now, let’s look at the most common reasons for ending the game:
| Reason | Frequency |
|---|---|
| composite | 189970 |
| prime | 133022 |
| time | 19480 |
| “Cause you\” | 2 |
Whoever tried and failed to send me a message through the end_reason field: maybe try email?
People are more likely to fail on a composite than on a prime. But there are more composites than primes, so you’d expect that. We need to correct for this – find $\Pr(\text{fail} \mid \text{shown a composite})$ and $\Pr(\text{fail} \mid \text{shown a prime})$:
\begin{align}
\Pr(\text{fail} \mid \text{prime}) &= 10.4\% \\
\Pr(\text{fail} \mid \text{composite}) &= 12.5\% \\
\end{align}
I think that means that if you’re in doubt, you should go for prime.
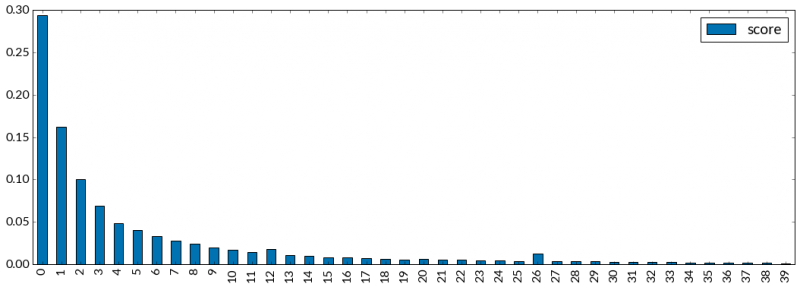
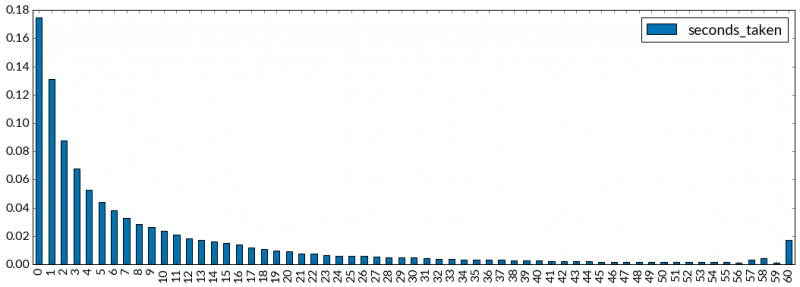
Finally, let’s look at the distributions of scores and time taken, separately: (the $y$ axis is “proportion of games played”)
That bump at score 26 is very prominent, and there’s a fun bump at 57 and 58 seconds into the game, when players panic and start making bad decisions. Otherwise, these graphs look as you’d expect: most games end early and don’t take very long. I had wondered whether the mode of the score distribution would be a number greater than zero, but I suppose people getting carried away and frantically clicking buttons after they start a new game must account for a lot of the zero scores.
That’s all I can think of to do with the data I’ve got. I don’t know why I didn’t record an IP address or some other identifying information with each record, which would’ve let me look at things like whether players improve over time. Oh well!
I reckon someone else could make better use of this data, so I’ve put it online to download and play with (53Mb .tsv file). In the interests of open science and all that tosh, here’s the very messy Jupyter notebook I used to generate the stats in this post.


Some of these are easy to catch: remember that any number where the sum of the digits is divisible by 3, is divisible by 3. the same goes for 9. So no one should be fooled by any multiples of 3 or 9. Clearly the difficult ones are multiples of large primes, so for example you can be excused if you find 11* 17= 187 to be prime. but not if you find 1371 prime since we know that 1+3+7+1=12 and 12 is divisible by 3 therefore 1371 must be divisible by 3.
I love your “Is this prime?” game. Multiples of 2 or even numbers are not presented during the 60 second game probably because outside of the number 2 itself they are not prime. Odd multiples of 5 outside of 5 itself are not prime and are also easily recognized. I think eliminating odd multiples of 5 or an option to do so would provide an improved and more edifying challenge in each 60 second game.
1 is prime.
no.