I’m slowly working to (sort of) recreate Martin Gardner’s cover images from Scientific American, the so-called Gardner’s Dozen.
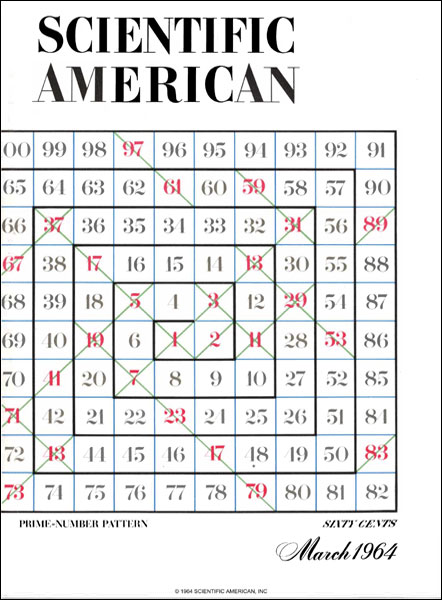
This time it’s the turn of the March 1964 issue. In the article ‘The remarkable lore of the prime numbers’, later included as chapter 9 in Martin Gardner’s Sixth Book of Mathematical Games from Scientific American, Gardner describes how Stanislaw Ulam in a boring meeting doodled a grid of numbers, spiralling out, then circled the primes. “To his surprise the primes seemed to have an uncanny tendency to crowd into straight lines.” These Ulam sprials, discovered the year before, contain lines related to prime-generating functions, which I have written about recently.
I tried to write code for this that worked as the original doodle – starting in the middle with 1 and working from cell to cell outwards in an anticlockwise spiral.
To start, I set up a document like this. I’m going to use TikZ for the drawing, as usual, and etoolbox for some conditional logic.
\documentclass{standalone}
\usepackage{tikz}
\usepackage{etoolbox}
\begin{document}%

\end{document}
To move from cell to cell, I set some global counters to keep track of the current number (n), location, and the direction of the move to the next cell. The location is a pair of coordinates (x and y, initially (0,0)) and the direction of the move to the next cell is also a pair of values (xdir and ydir, initially (1,0)).
\newcounter{n}%
\setcounter{n}{1}%
\newcounter{x}%
\setcounter{x}{0}%
\newcounter{y}%
\setcounter{y}{0}%
\newcounter{xdir}%
\setcounter{xdir}{1}%
\newcounter{ydir}%
\setcounter{ydir}{0}%
The value of a counter called A is displayed in the document using a command \theA, but if the value is needed for a calculation then it is accessed using \value{A}. The % at the end of each line mean we ignore the whitespace, meaning the tikzpicture that we’re about to draw doesn’t have a load of blank spaces before it.
Next I drew a grid. I used scope to offset this by (0.5,0.5). This is so that I could place the numbers at integer coordinates even though the command grid puts its lines through integer points. Basically this means I don’t have to faff with lots of .5 values in the rest of the code.
\begin{tikzpicture}
    \begin{scope}[shift={(0.5,0.5)}]
        \draw (-5,-5) grid (5,5);
    \end{scope}
\end{tikzpicture}
Next I drew a node at the centre of the grid to hold the number 1. This goes within the tikzpicture above, as do all the drawing commands.
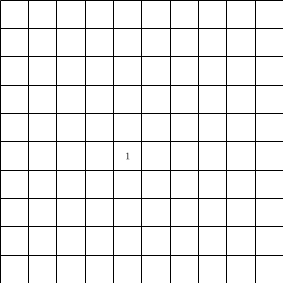
\node at (0,0) {\then};I’m now looking at a grid which contains the number 1. Not the most exciting, but it’s a start!
Drawing the other numbers is a matter of setting up some loops. After the initial 1, the doodle draws:
- one cell then turn
- one cell then turn
- two cells then turn
- two cells then turn
- …
And so on until nine cells. First I set a loop on \i from 1 to 9 to represent that the length of the run of cells grows from 1 to 9. Within this, I put a loop on \k from 1 to 2 because, as noted above, each length of cells is repeated twice. Within this, I draw the actual cells using a loop on j which ranges from 1 to the current value of \i. These loops look like this:
\foreach \i in {1,...,9}{
    \foreach \k in {1,2}{
        \foreach \j in {1,...,\i}{

        }
    }
}
Within the inner loop, I first increase n.
\addtocounter{n}{1}Then I move x and y to the next cell position. This means increasing x by xdir and y by ydir. I first use \pgfmathsetmacro to do the calculation and store the result in \x and \y, then use these values to update my x and y counters and to draw the new number. I use global counters in this way rather than the commands \x and \y directly because the values of \x and \y don’t persist between loops.
\pgfmathsetmacro{\x}{\value{x}+\value{xdir}};
\pgfmathsetmacro{\y}{\value{y}+\value{ydir}};
\setcounter{x}{\x};
\setcounter{y}{\y};
\node at (\x,\y) {\then};
At the moment, this will just keep drawing cells in a straight line. This is because I haven’t implemented the turns. This is a bit fiddly, but I was thinking of (xdir,ydir) as a vector pointing the way to the next cell. As such, the procession is:
- move to the right: (1,0);
- move to the cell above: (0,1);
- move to the left: (-1,0);
- move to the cell below: (0,-1).
I need to update these to the next direction outside the \j loop but inside the \k loop. From the procession above, I notice that if xdir is 0 in the current iteration, then ydir is going to be 0 in the next, and if xdir is currently non-zero then it is going to be 0 in the next iteration. In the cases where xdir is zero, if ydir is 1 then xdir becomes -1 and otherwise it becomes 1. Similarly, if xdir is non-zero then either xdir is 1 and ydir should change to 1 or else ydir should change to -1.
I implement this as a series of if statements using \ifnumequal from etoolbox. These are used to set the values of the counters xdir and ydir.
\ifnumequal{\value{xdir}}{0}{
    \ifnumequal{\value{ydir}}{1}{
        \setcounter{xdir}{-1}; % left
    }{
        \setcounter{xdir}{1}; % right
    }
    \setcounter{ydir}{0};
}{
    \ifnumequal{\value{xdir}}{1}{
        \setcounter{ydir}{1}; % up
    }{
        \setcounter{ydir}{-1}; % down
    }
    \setcounter{xdir}{0};
}
Now I’m looking at a grid that spirals numbers, but only up to 91.
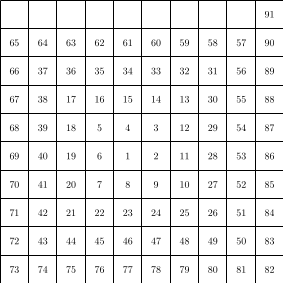
The reason for this is that each length of cells drawn occurs twice until the last. Instead of going into two runs of 10 cells, the cover image stops at 100. To fix this I need to alter the \k loop so that it runs a third time when \i is 9. This is a bit fiddly, but you can see how I did it in the full code below.
The other important aspect of this diagram is that the primes are highlighted with red text and green diagonals. Let’s focus on the red text. Without wanting to write a prime number checker into my LaTeX, I figured I would do what I’d do if I were doodling this by hand – cross-reference with a list of primes.
I did this using commands from etoolbox. First, before my tikzpicture, I set up a command \col to hold the current colour (initially black), and a list of \primes.
\newcommand{\col}{black}%
\newcommand{\primes}{}%
\forcsvlist{\listadd\primes}{2,3,5,7,11,13,17,19,23,29,31,37,41,43,47,53,59,61,67,71,73,79,83,89,97}%
Now inside my \j loop, after incrementing the counter, I tested whether the current value of n (\then) is in the list of primes. If it is, then I set \col to red, and if not black.
\xifinlist{\then}{\primes}{\renewcommand{\col}{red}}{\renewcommand{\col}{black}}Finally, I changed the command that draws each number to set the text to the colour stored in \col.
\node[\col] at (\x,\y) {\then};Putting all this together, I’m now looking at a spiral up to 91 with primes marked.
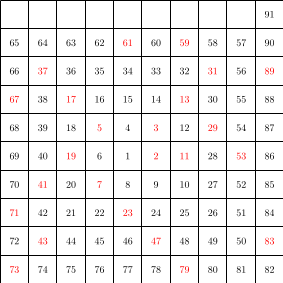
From here, the rest is fairly cosmetic or similar to what we have already done. A bit of colouring, a twist to the \k loop adds the numbers 92-100, some conditional statements on the current direction draw the thick border to indicate the direction of the spiral, and a pair of lists identify which primes are crossed with one diagonal or the other.
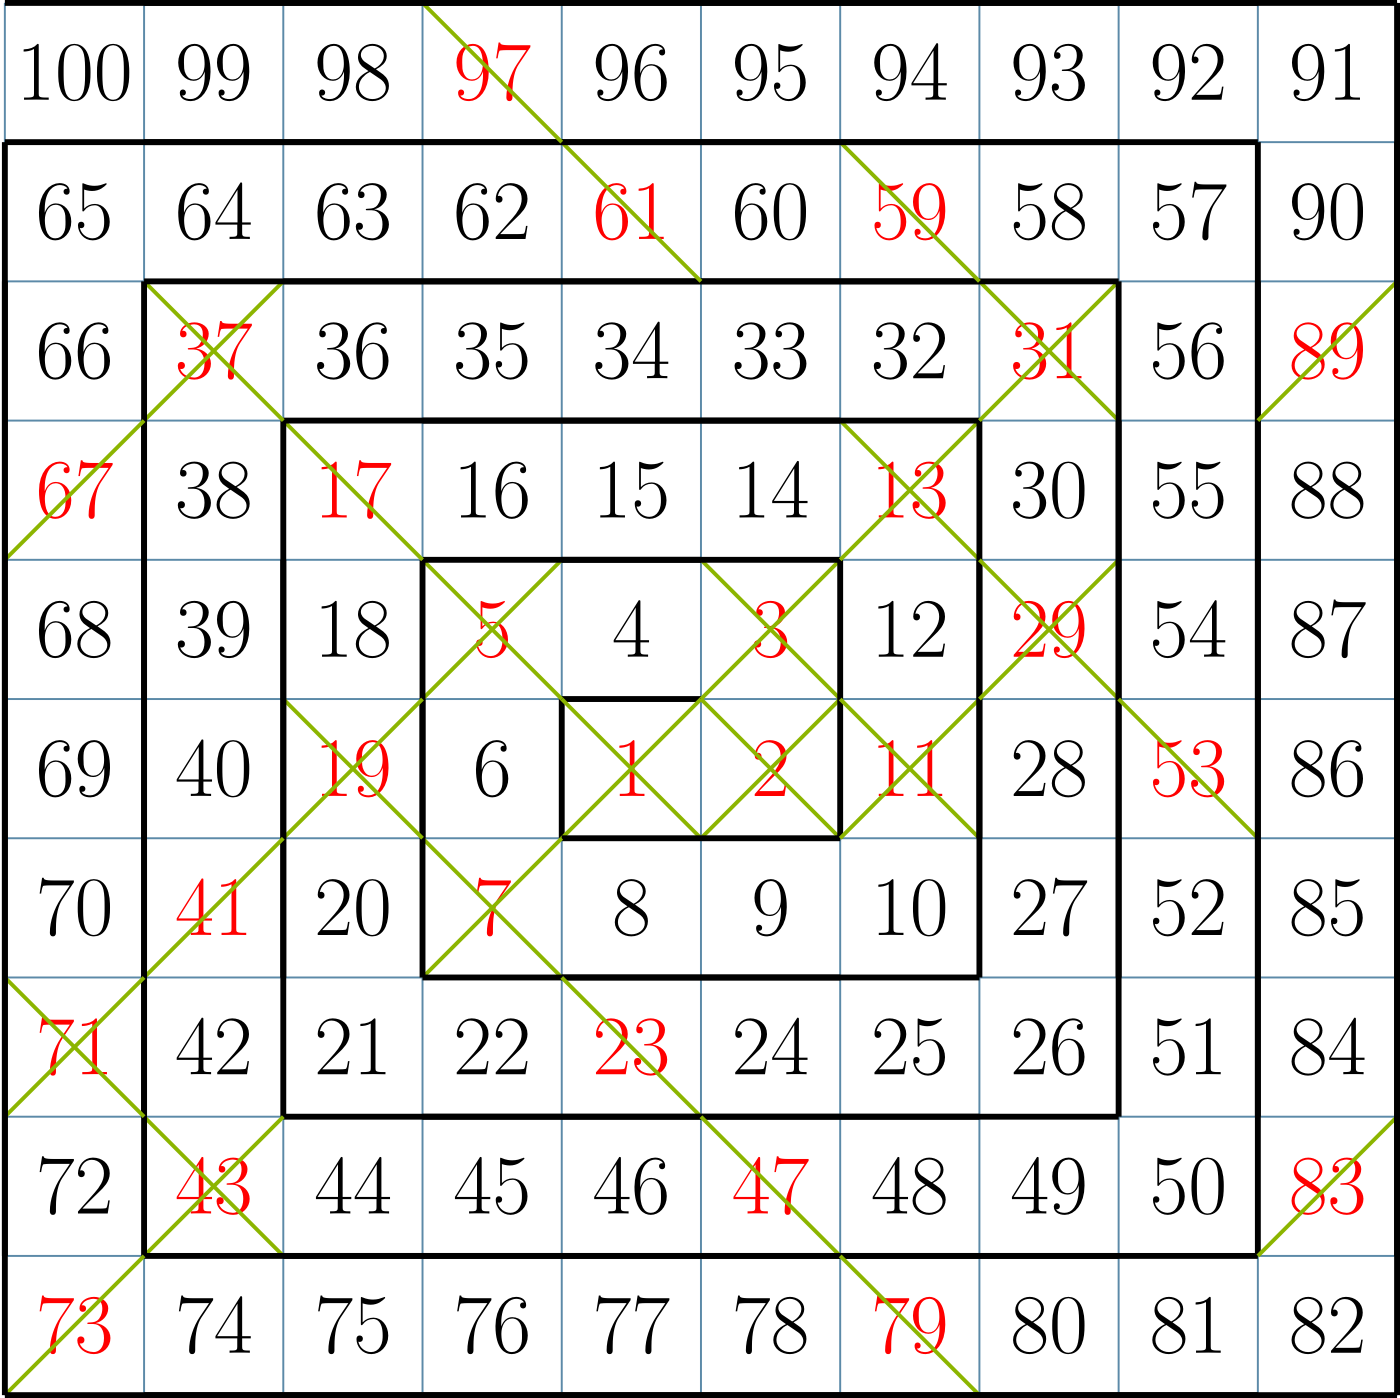
The final result is this, an Ulam sprial to 100.