Can you believe it’s been 10 years since I made the “Is this prime?” game? I sort of can, because I set myself a reminder about it in my calendar.
Back in 2016, the game had been played 350,000 times and I wrote a post looking at the collected data.
10 years later, I thought I’d have another look.
These are the questions I want to answer:
- How many games have been played?
- Have people got better at the game?
- Has the average score increased?
- Have any Grothendiecky numbers become common knowledge?
- What’s the cheating like?
As I’m writing this, on the 8th of March 2026, I’ve recorded 8,209,714 games. The millionth game happened on the 19th of October 2018, and the 8 million mark was passed just a few months ago, on the 28th of November 2025.
(But I have good reasons to believe quite a few of those aren’t real attempts by a human. I’ve removed about 730,000 obviously invalid attempts from the data set, for a reason I’ll explain later.)
Now, to delve into the statistical questions, I’m going to rerun the IPython notebook I wrote back in 2016, with the latest data. I’m a busy boy and I don’t have the time to apply a decade’s worth of data analysis skill development.
I’ll actually start with a new plot: the total number of recorded games over time. It’s much steadier than I expected, apart from a big jump at the end of 2022. It looks like it’s curving upwards slightly.
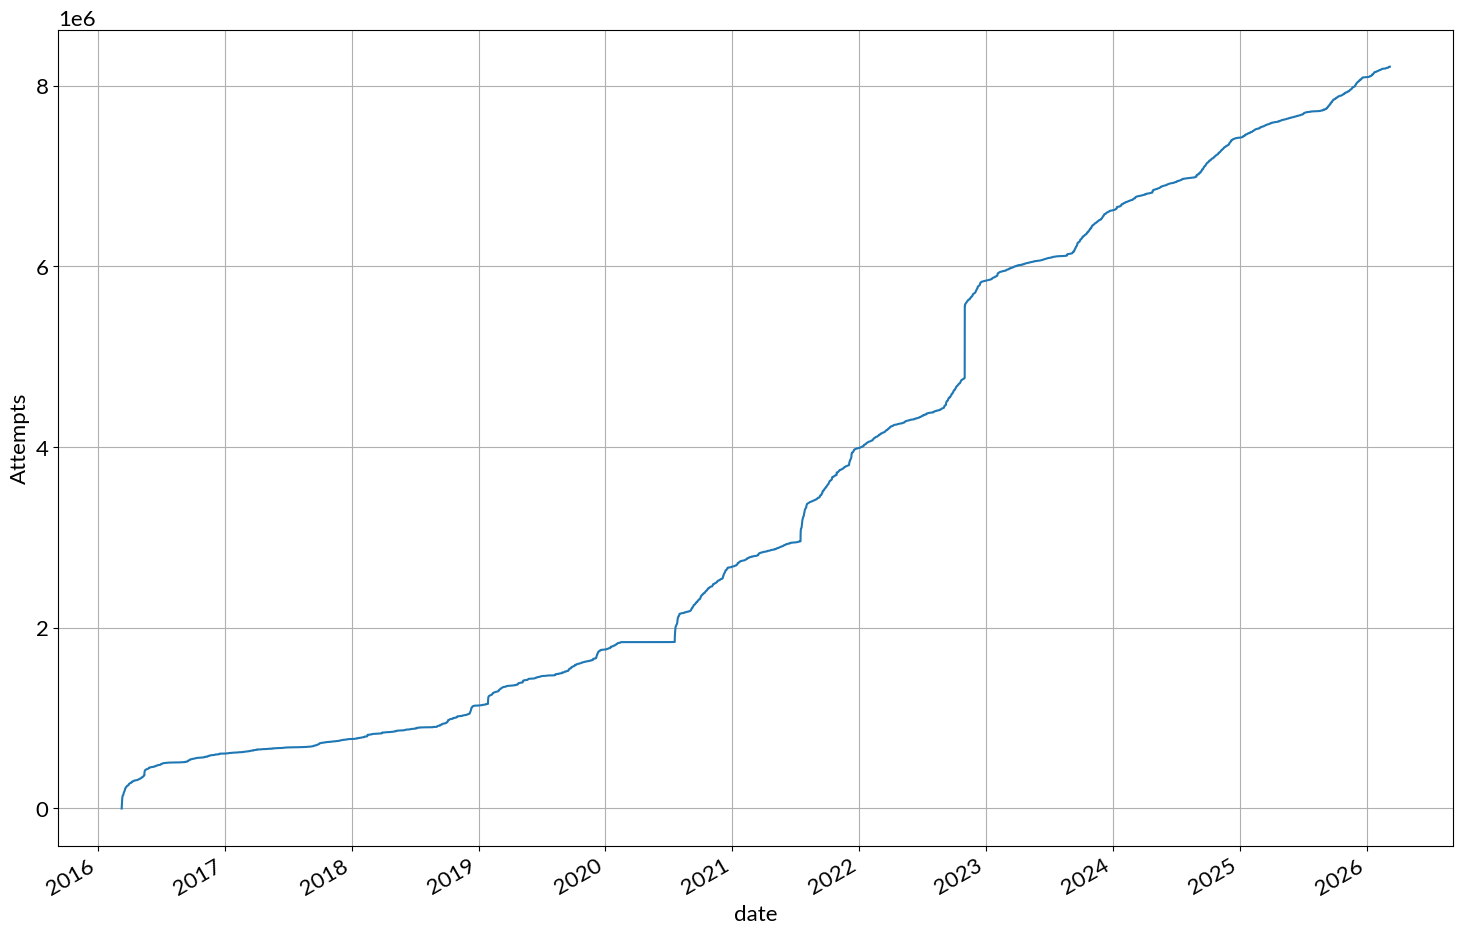
I thought I’d better investigate that big jump. It turns out to be due to someone spamming the records with 785,964 copies of the same game, ending on number 87. I’ll just remove those.
So the graph of attempts over time now looks like this:
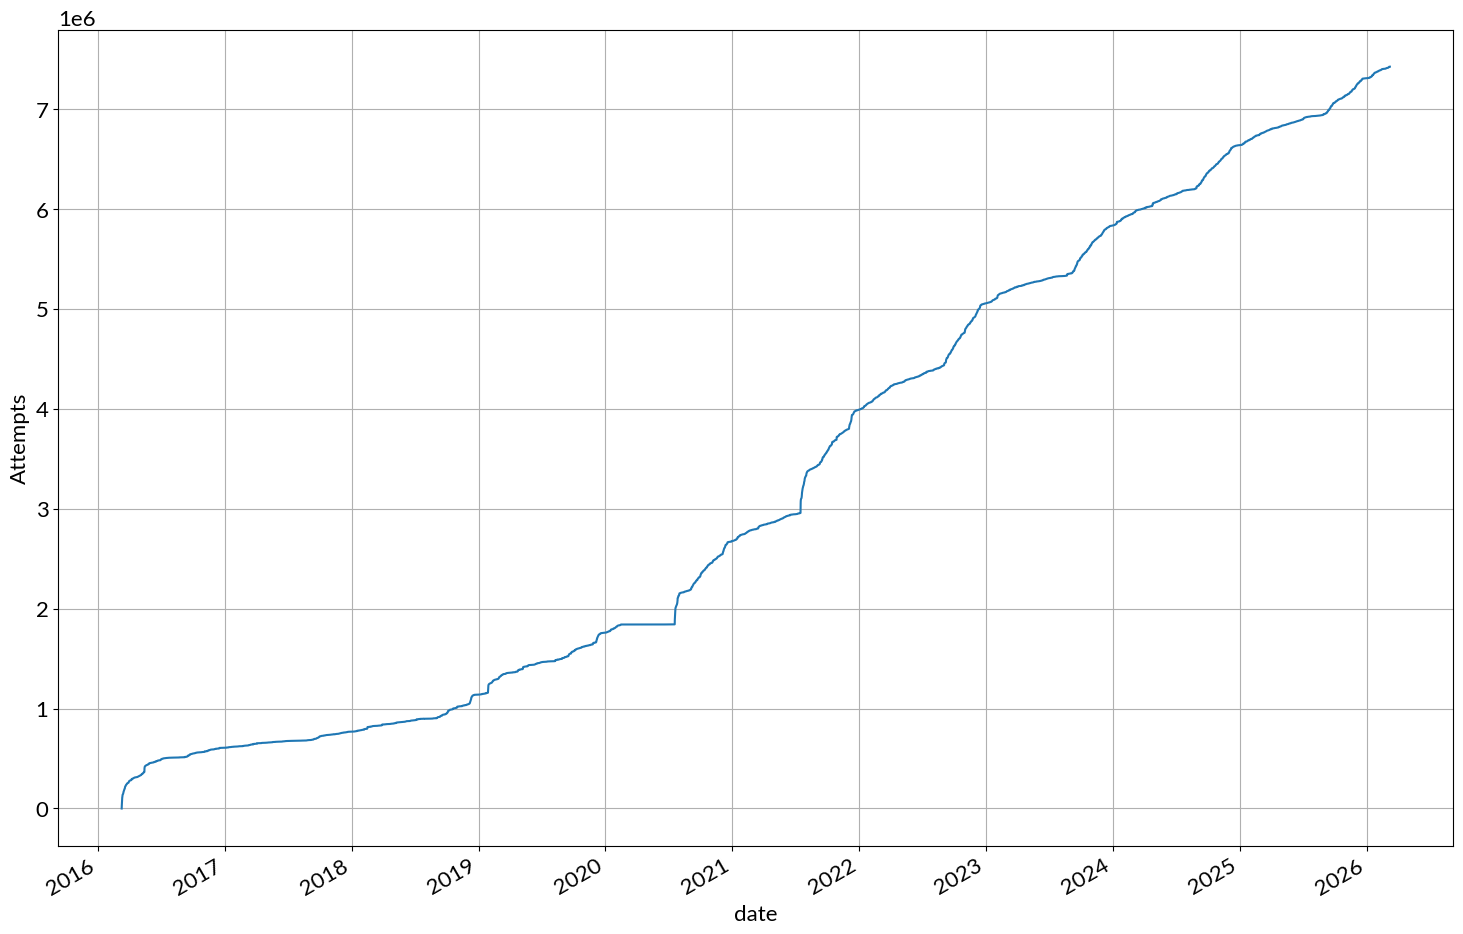
Now the only obvious straight line is a horizontal bit in 2020 when it mustn’t have been recording any data. I can’t remember that happening, but I do remember I had a lot on my mind at the time…
Moving back to the original notebook, here’s the plot of scores against time taken, 2016 vs 2026.

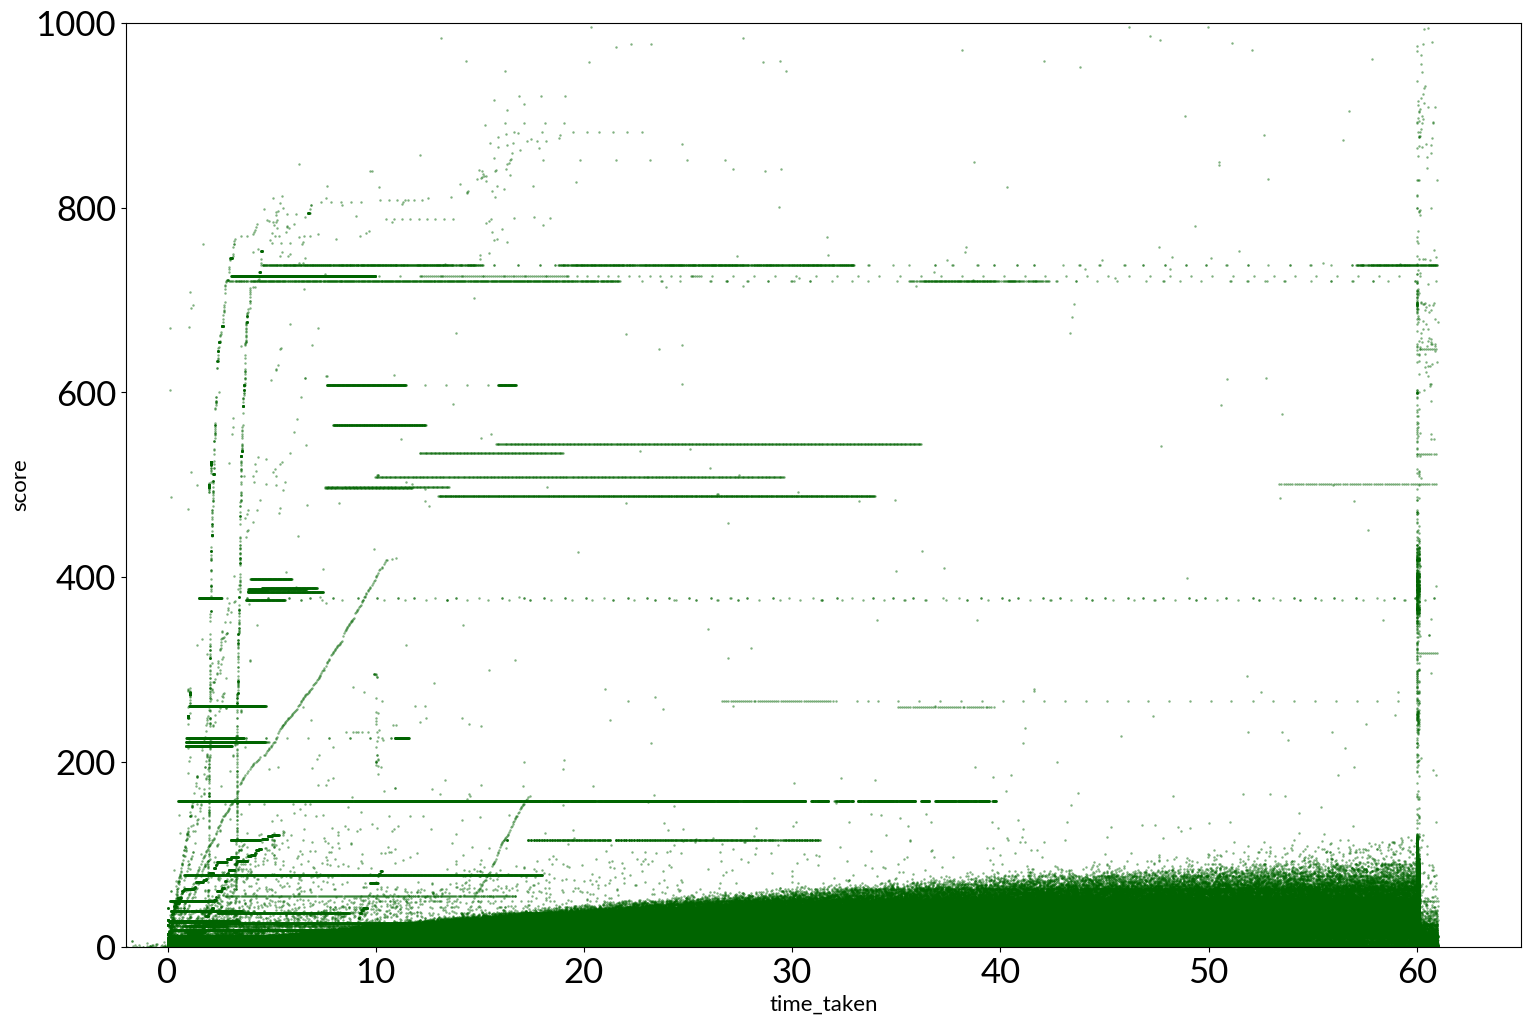
There are lots more clear lines corresponding to cheats, and lots of implausibly high scores. I wonder if the high scores that look randomly scattered, as compared to the ones on horizontal lines, are people who have written slow scripts to play the game for them, instead of just sending bulk data.
Here are the scores clipped to the range I think is achievable by humans. After seeing a video of someone getting over 100, I’ve expanded the range of scores to 150. There are enough scores between 100 and 200 that I have to wonder what the current record human-only score is.

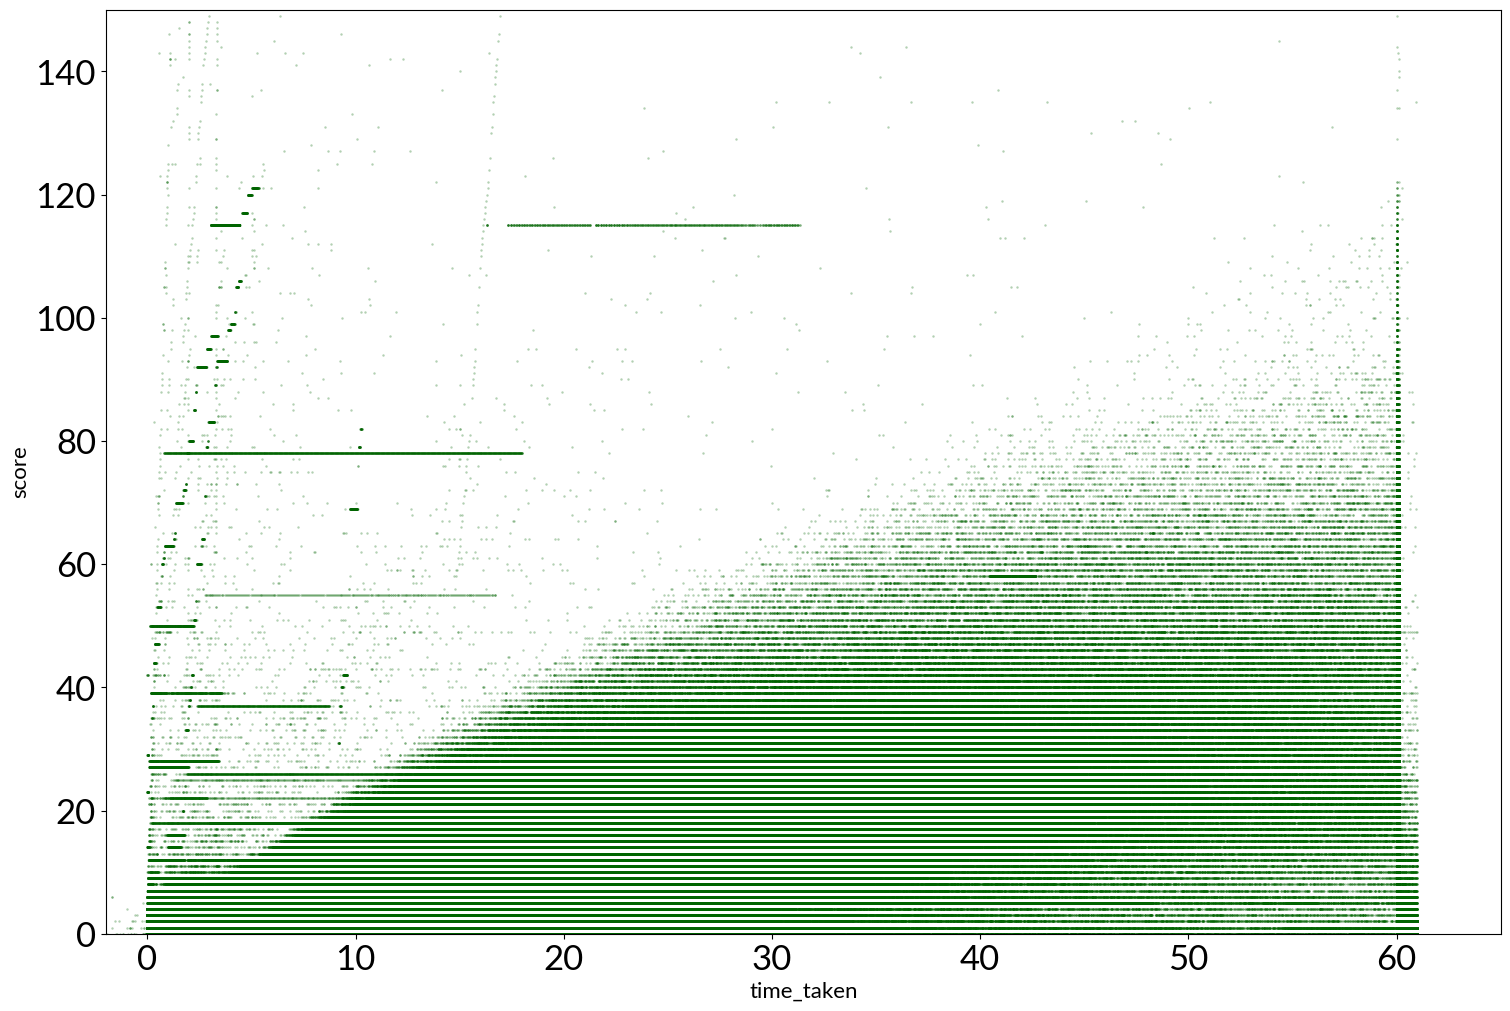
The most common score was 275. It’s now 375. That’s weird.
59% of games ended on a composite number, the same as in 2016.
On Boxing Day in 2022, someone decided to send 1139 fake records with the sequence ‘please change the position of the start again button since I continue to accidentally restart the game’. Fair comment. Email would have been easier.
To work out whether people are more likely to fail on composite numbers or primes, I computed the conditional probabilities:
\( \begin{align}
\Pr(\text{fail} \mid \text{prime}) &= 14.7\% & (10.4\% \text{ in 2016}) \\
\Pr(\text{fail} \mid \text{composite}) &= 18.2\% & (12.5\% \text{ in 2016}) \\
\end{align} \)
I think the fact that these probabilities are higher means that people have been getting slightly worse at the game. Does that sound right?
Here are the quantiles of the scores:
| Percentile | Score |
|---|---|
| 50% | 4 |
| 25% | 7 |
| 10% | 18 |
| 5% | 28 |
| 2.5% | 40 |
| 0.1% | 726 |
The graphs of score and time taken have both smoothed out to what looks like a power law.
TODO: why aren’t the x values in the below plots in order???

In 2016, I looked at which numbers are “Grothendiecky”: numbers that most people incorrectly misclassify as prime or composite.
The table of the 10 most common final numbers hasn’t changed significantly. 1 and 39 have swapped places, but 51 keeps its position as most Grothendiecky number. 87 has dropped out of the top 10 completely, down to 14th. Maybe that’s why the ballot was stuffed?
| Final number | Reason for ending | Frequency | |
|---|---|---|---|
| 51 | composite | 398789 | 5.37% |
| 57 | composite | 394808 | 5.32% |
| 1 | composite | 258949 | 3.49% |
| 39 | composite | 257888 | 3.47% |
| 63 | composite | 210667 | 2.83% |
| 49 | composite | 204856 | 2.76% |
| 5 | composite | 193553 | 2.60% |
| 69 | prime | 192822 | 2.60% |
| 27 | composite | 181129 | 2.44% |
| 9 | composite | 180842 | 2.38% |
But looking at things a little bit differently, things turn around slightly. The probability that a number is misclassified once it’s shown is slightly higher for 57, at 41.5%, compared to 51, at 41.0%. So more games end on 51 because it’s a smaller number, but if someone does get to 57, they’re slightly more likely to say it’s prime. Grothendieck is vindicated.
Finally, here’s a plot of \(\Pr(\text{fail} \mid \text{shown})\), to visually spot Grothendiecky numbers:

To me, the numbers that stick out are 51, 57, 87, 91, and 119. A case could also be made for 39, but it’s not as big an outlier.
It doesn’t look like in 10 years any appreciable number of people have learnt that 51 is not a prime number. I’ll choose to believe that it’s not the same people playing for a decade and stubbornly refusing to learn, but a constant stream of new players who will eventually get the message.
So, there you go. Some up to date numbers.
I’m really proud of this game. I’ve loved going to schools and talking to teachers who tell me they play the game when the class needs a break or to warm up at the start of the day, and I love it when they’re surprised to find out that I wrote it. And 7.5 million goes at a maths game is no mean feat!