Here’s the eighth and final match in Round 1 of The Big Internet Math-Off. Today, we’re pitting Dave Richeson against Kit Yates.
Take a look at both pitches, vote for the bit of maths that made you do the loudest “Aha!”, and if you know any more cool facts about either of the topics presented here, please write a comment below!
Dave Richeson – A surprising application of graph theory to structural design
It is probably no surprise that an architect or structural engineer would need to know mathematics—geometry, trigonometry, and differential equations come to mind immediately, but graph theory? Not your first thought!
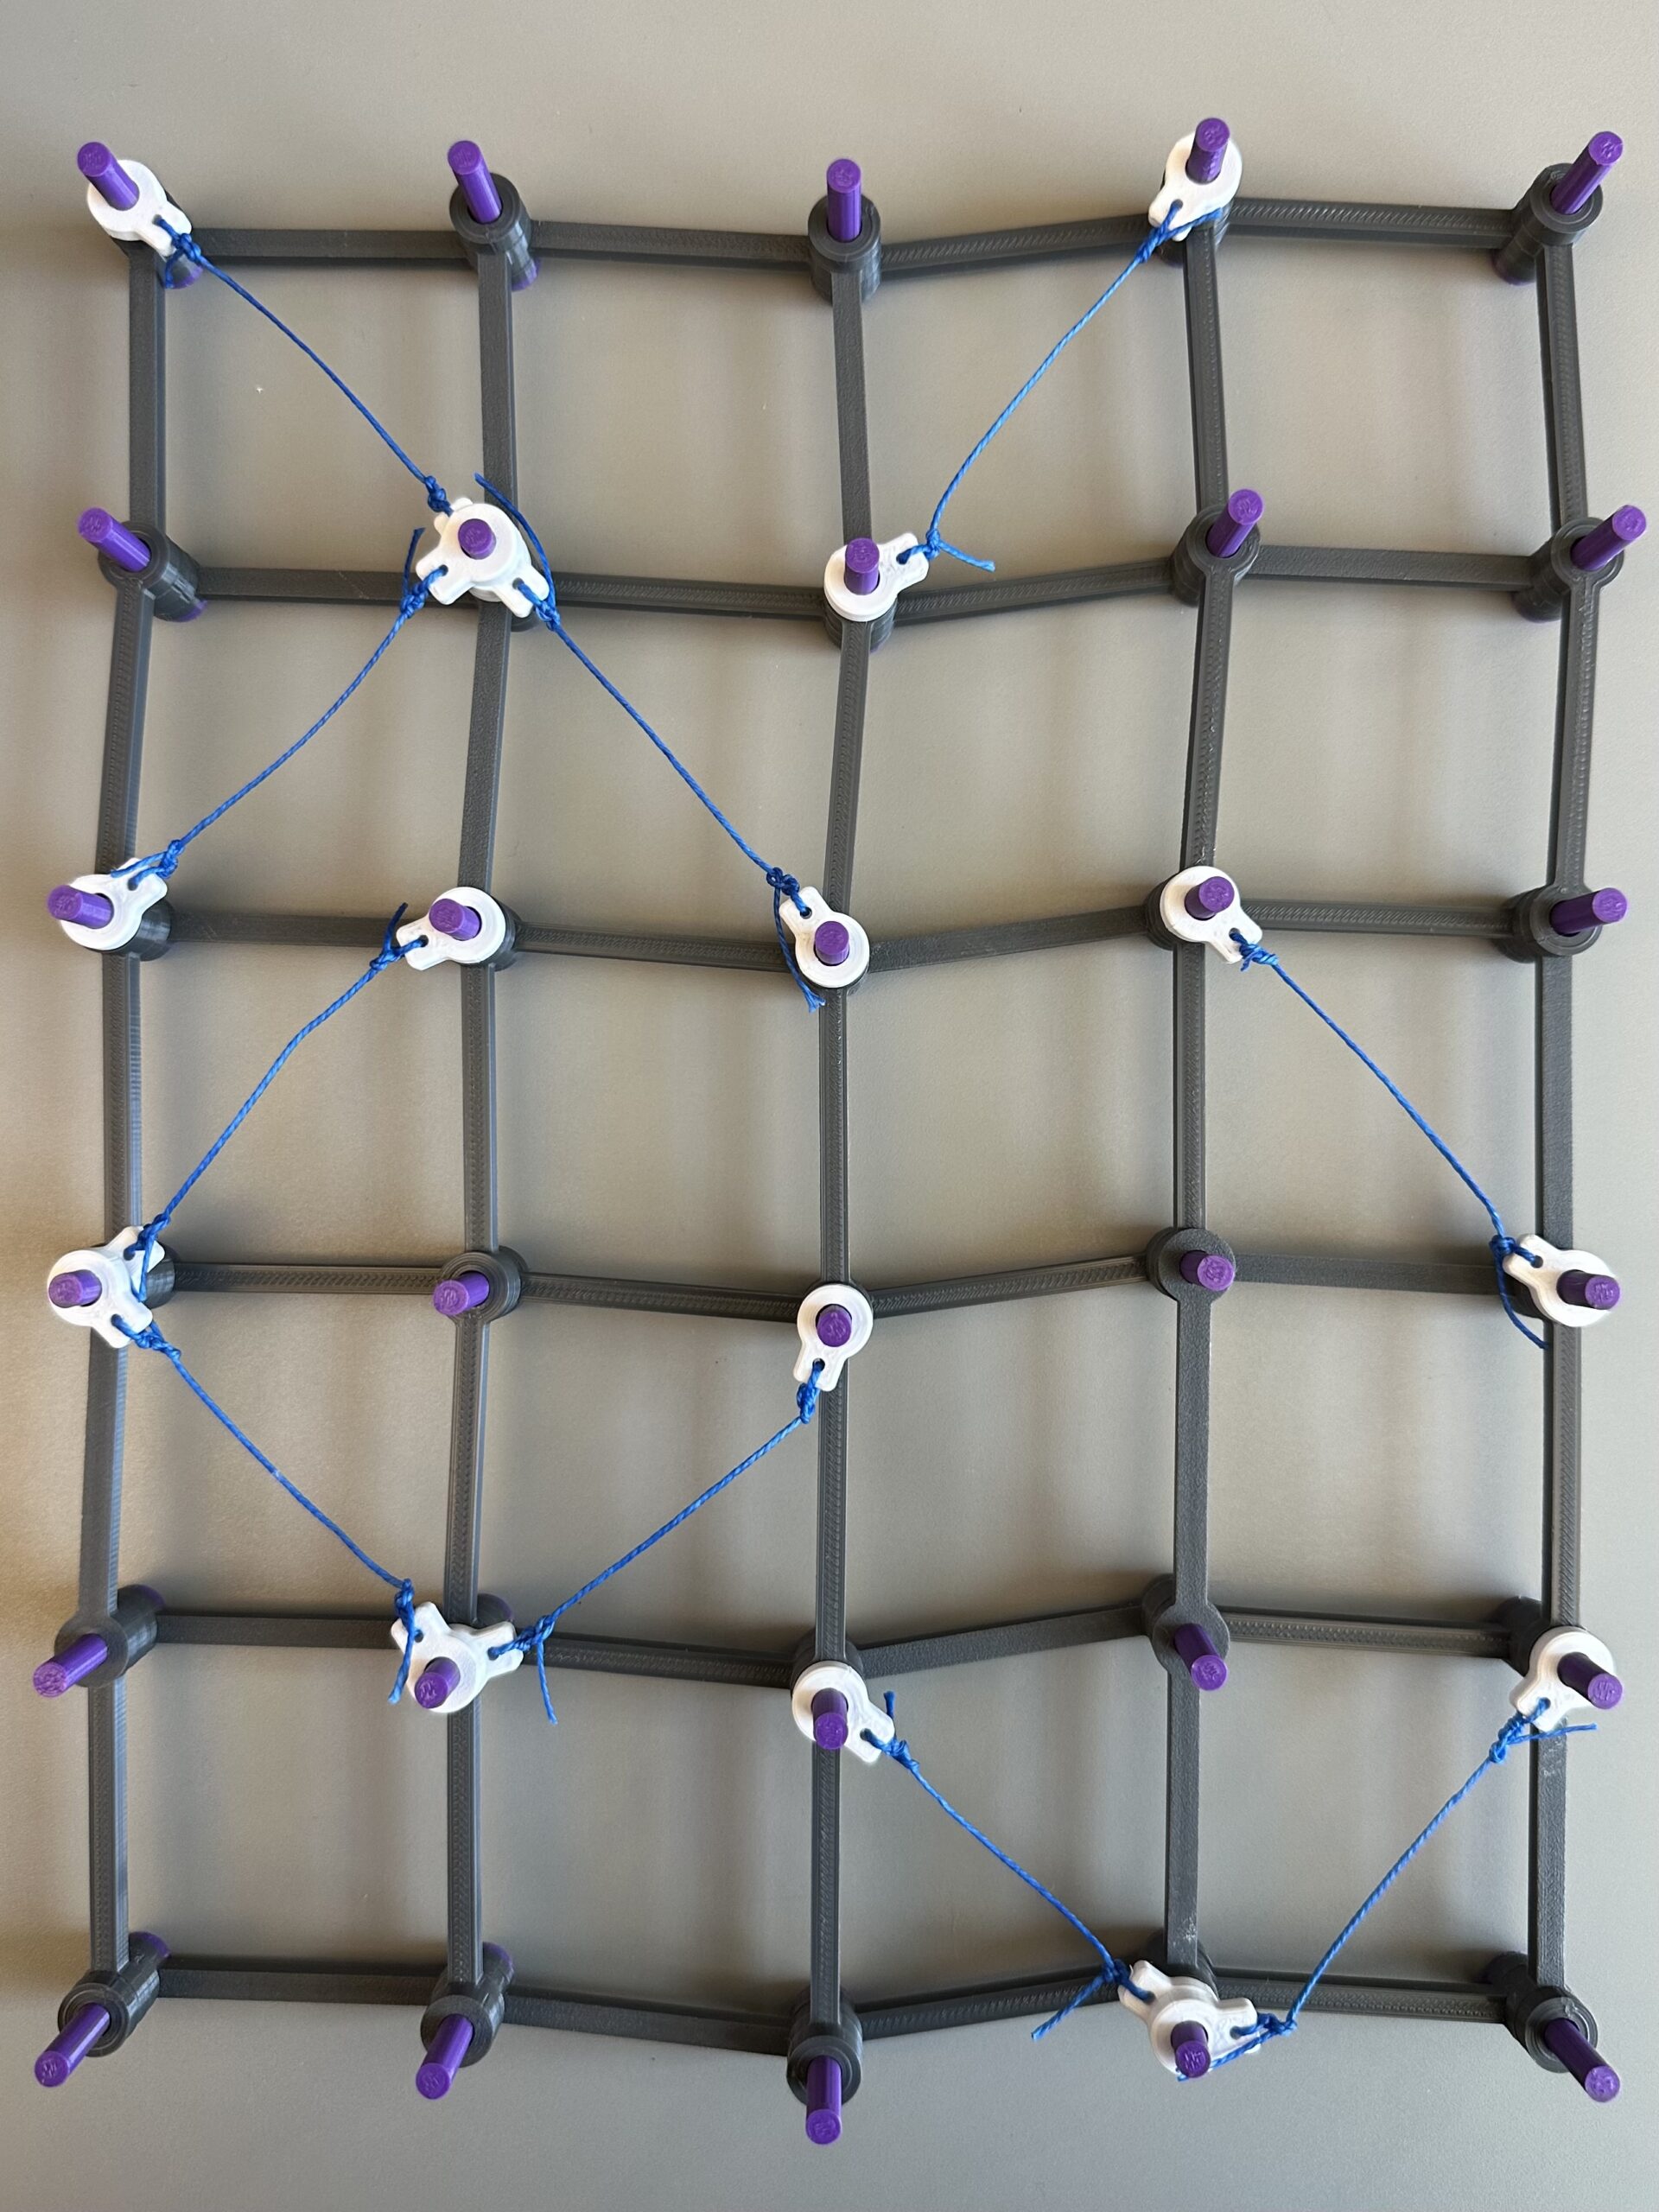
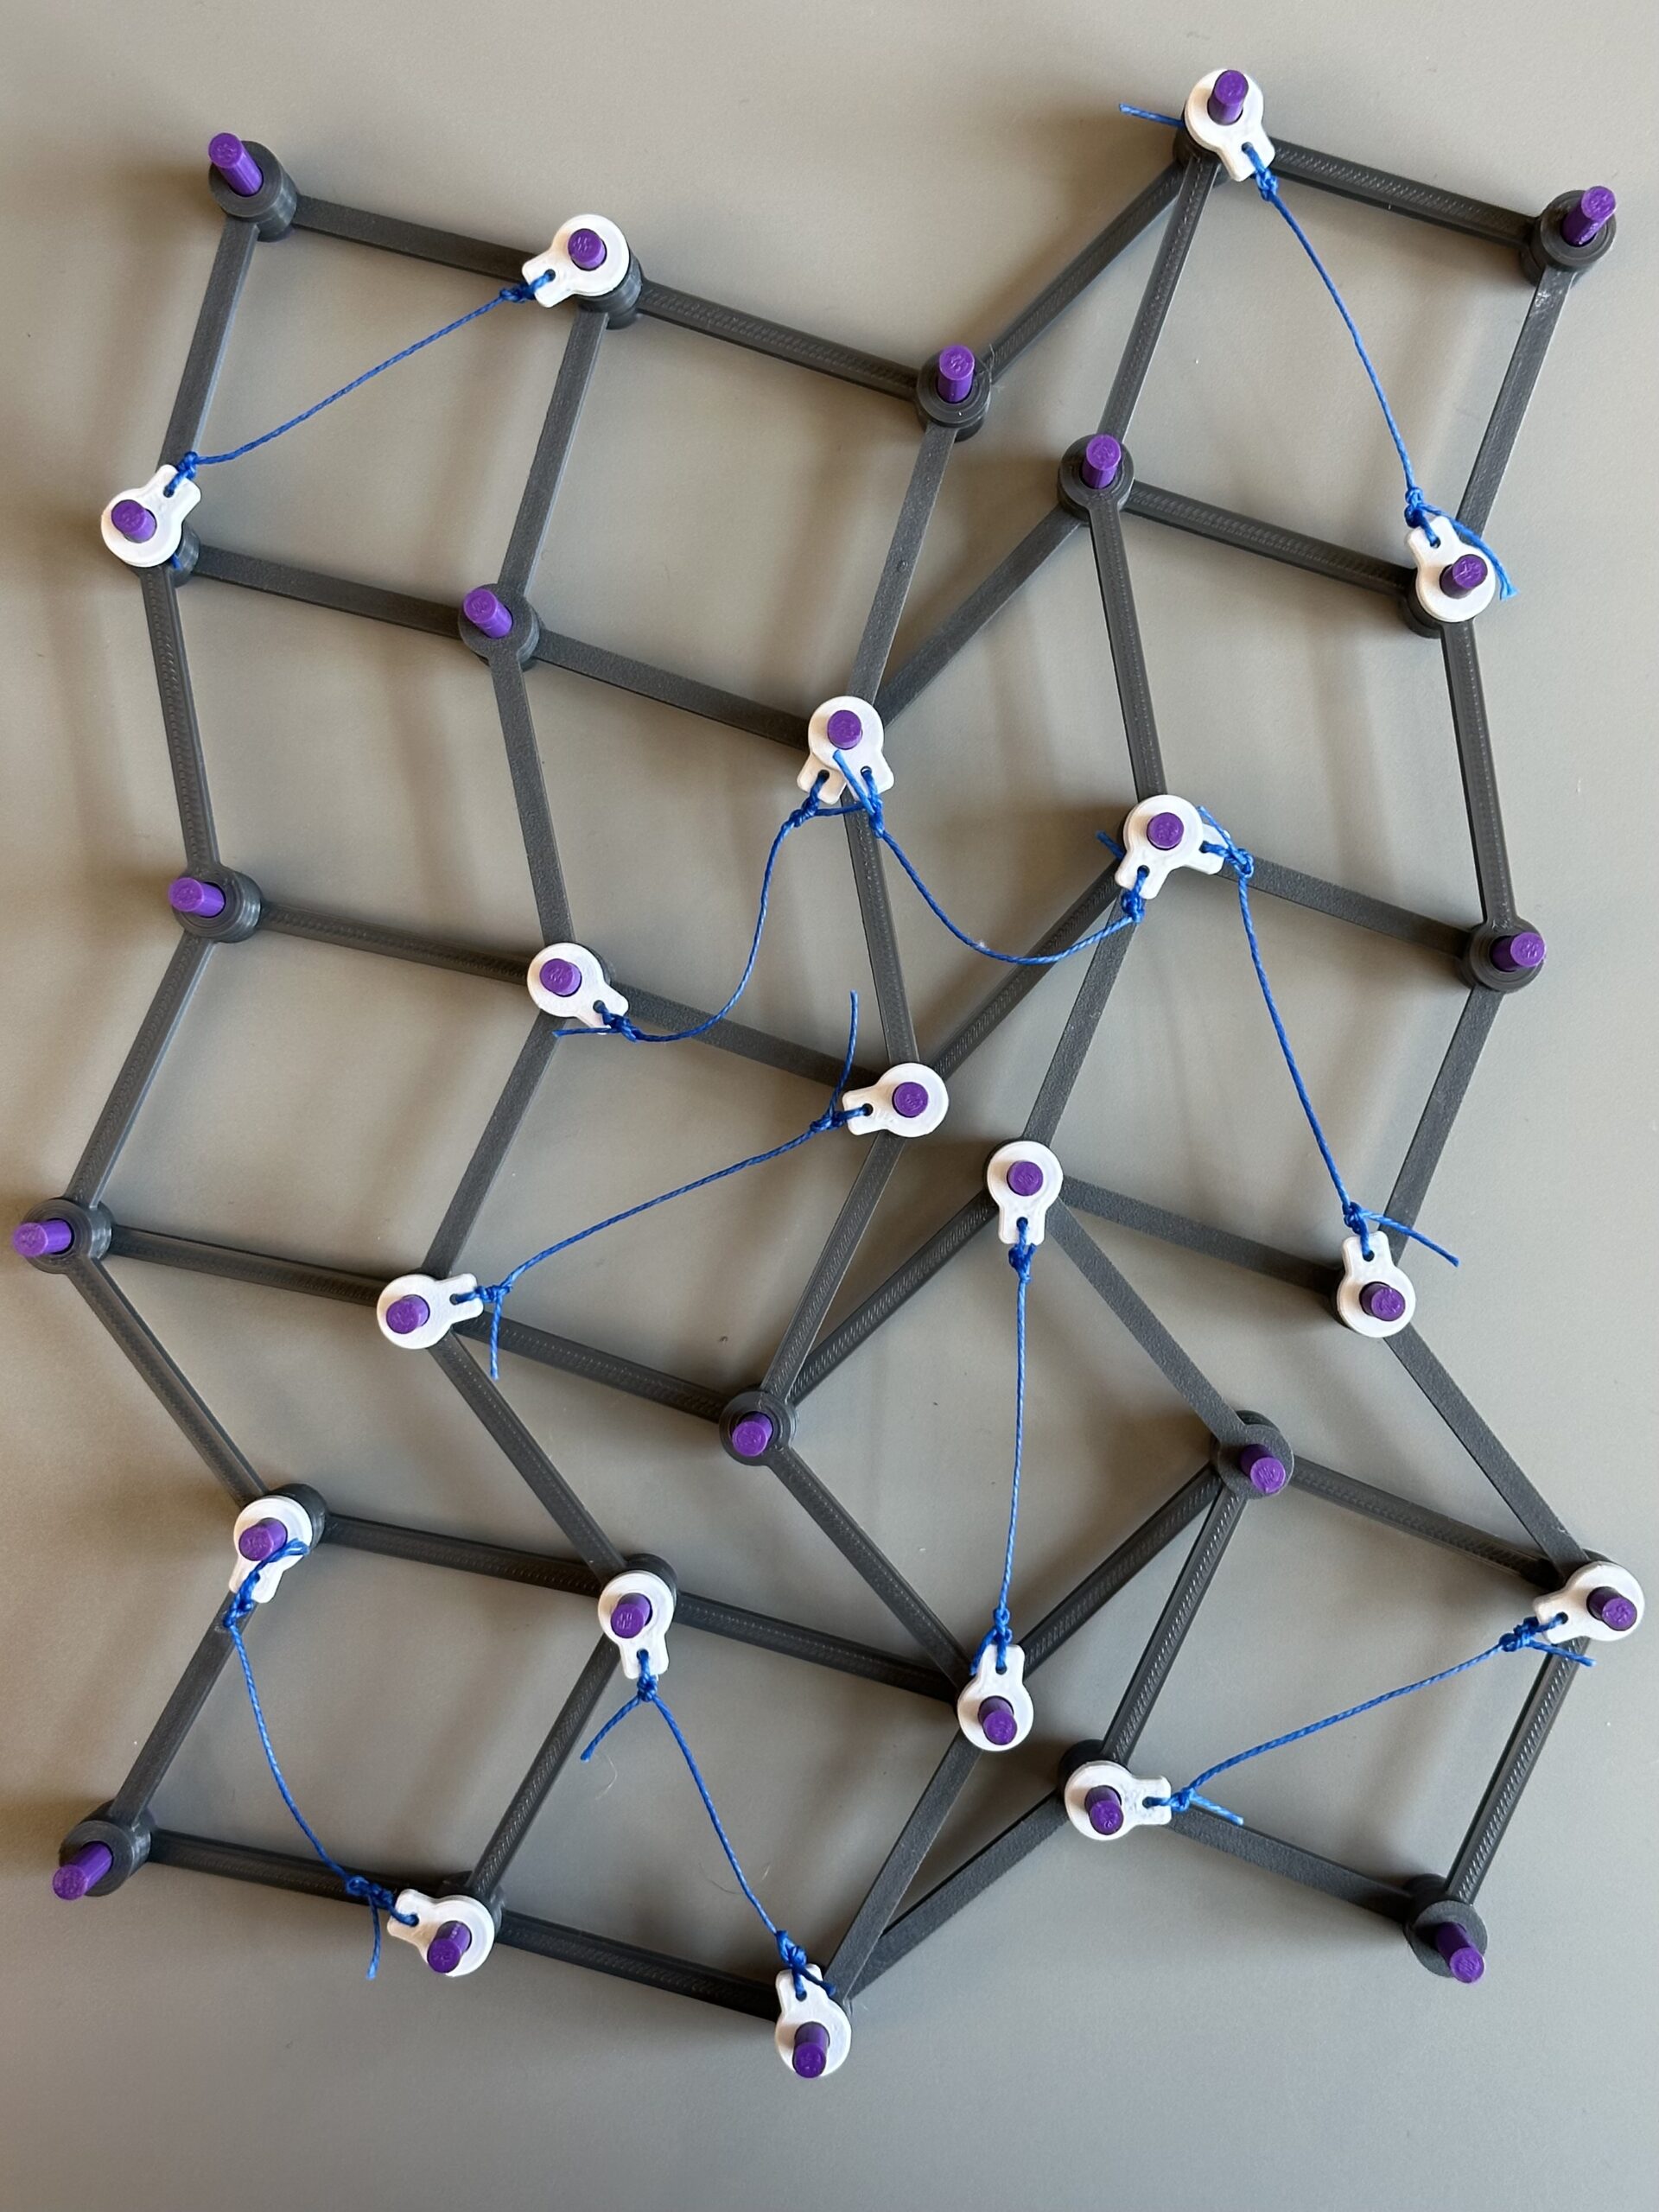
In preparation for this post, I designed and 3D-printed the objects shown below.
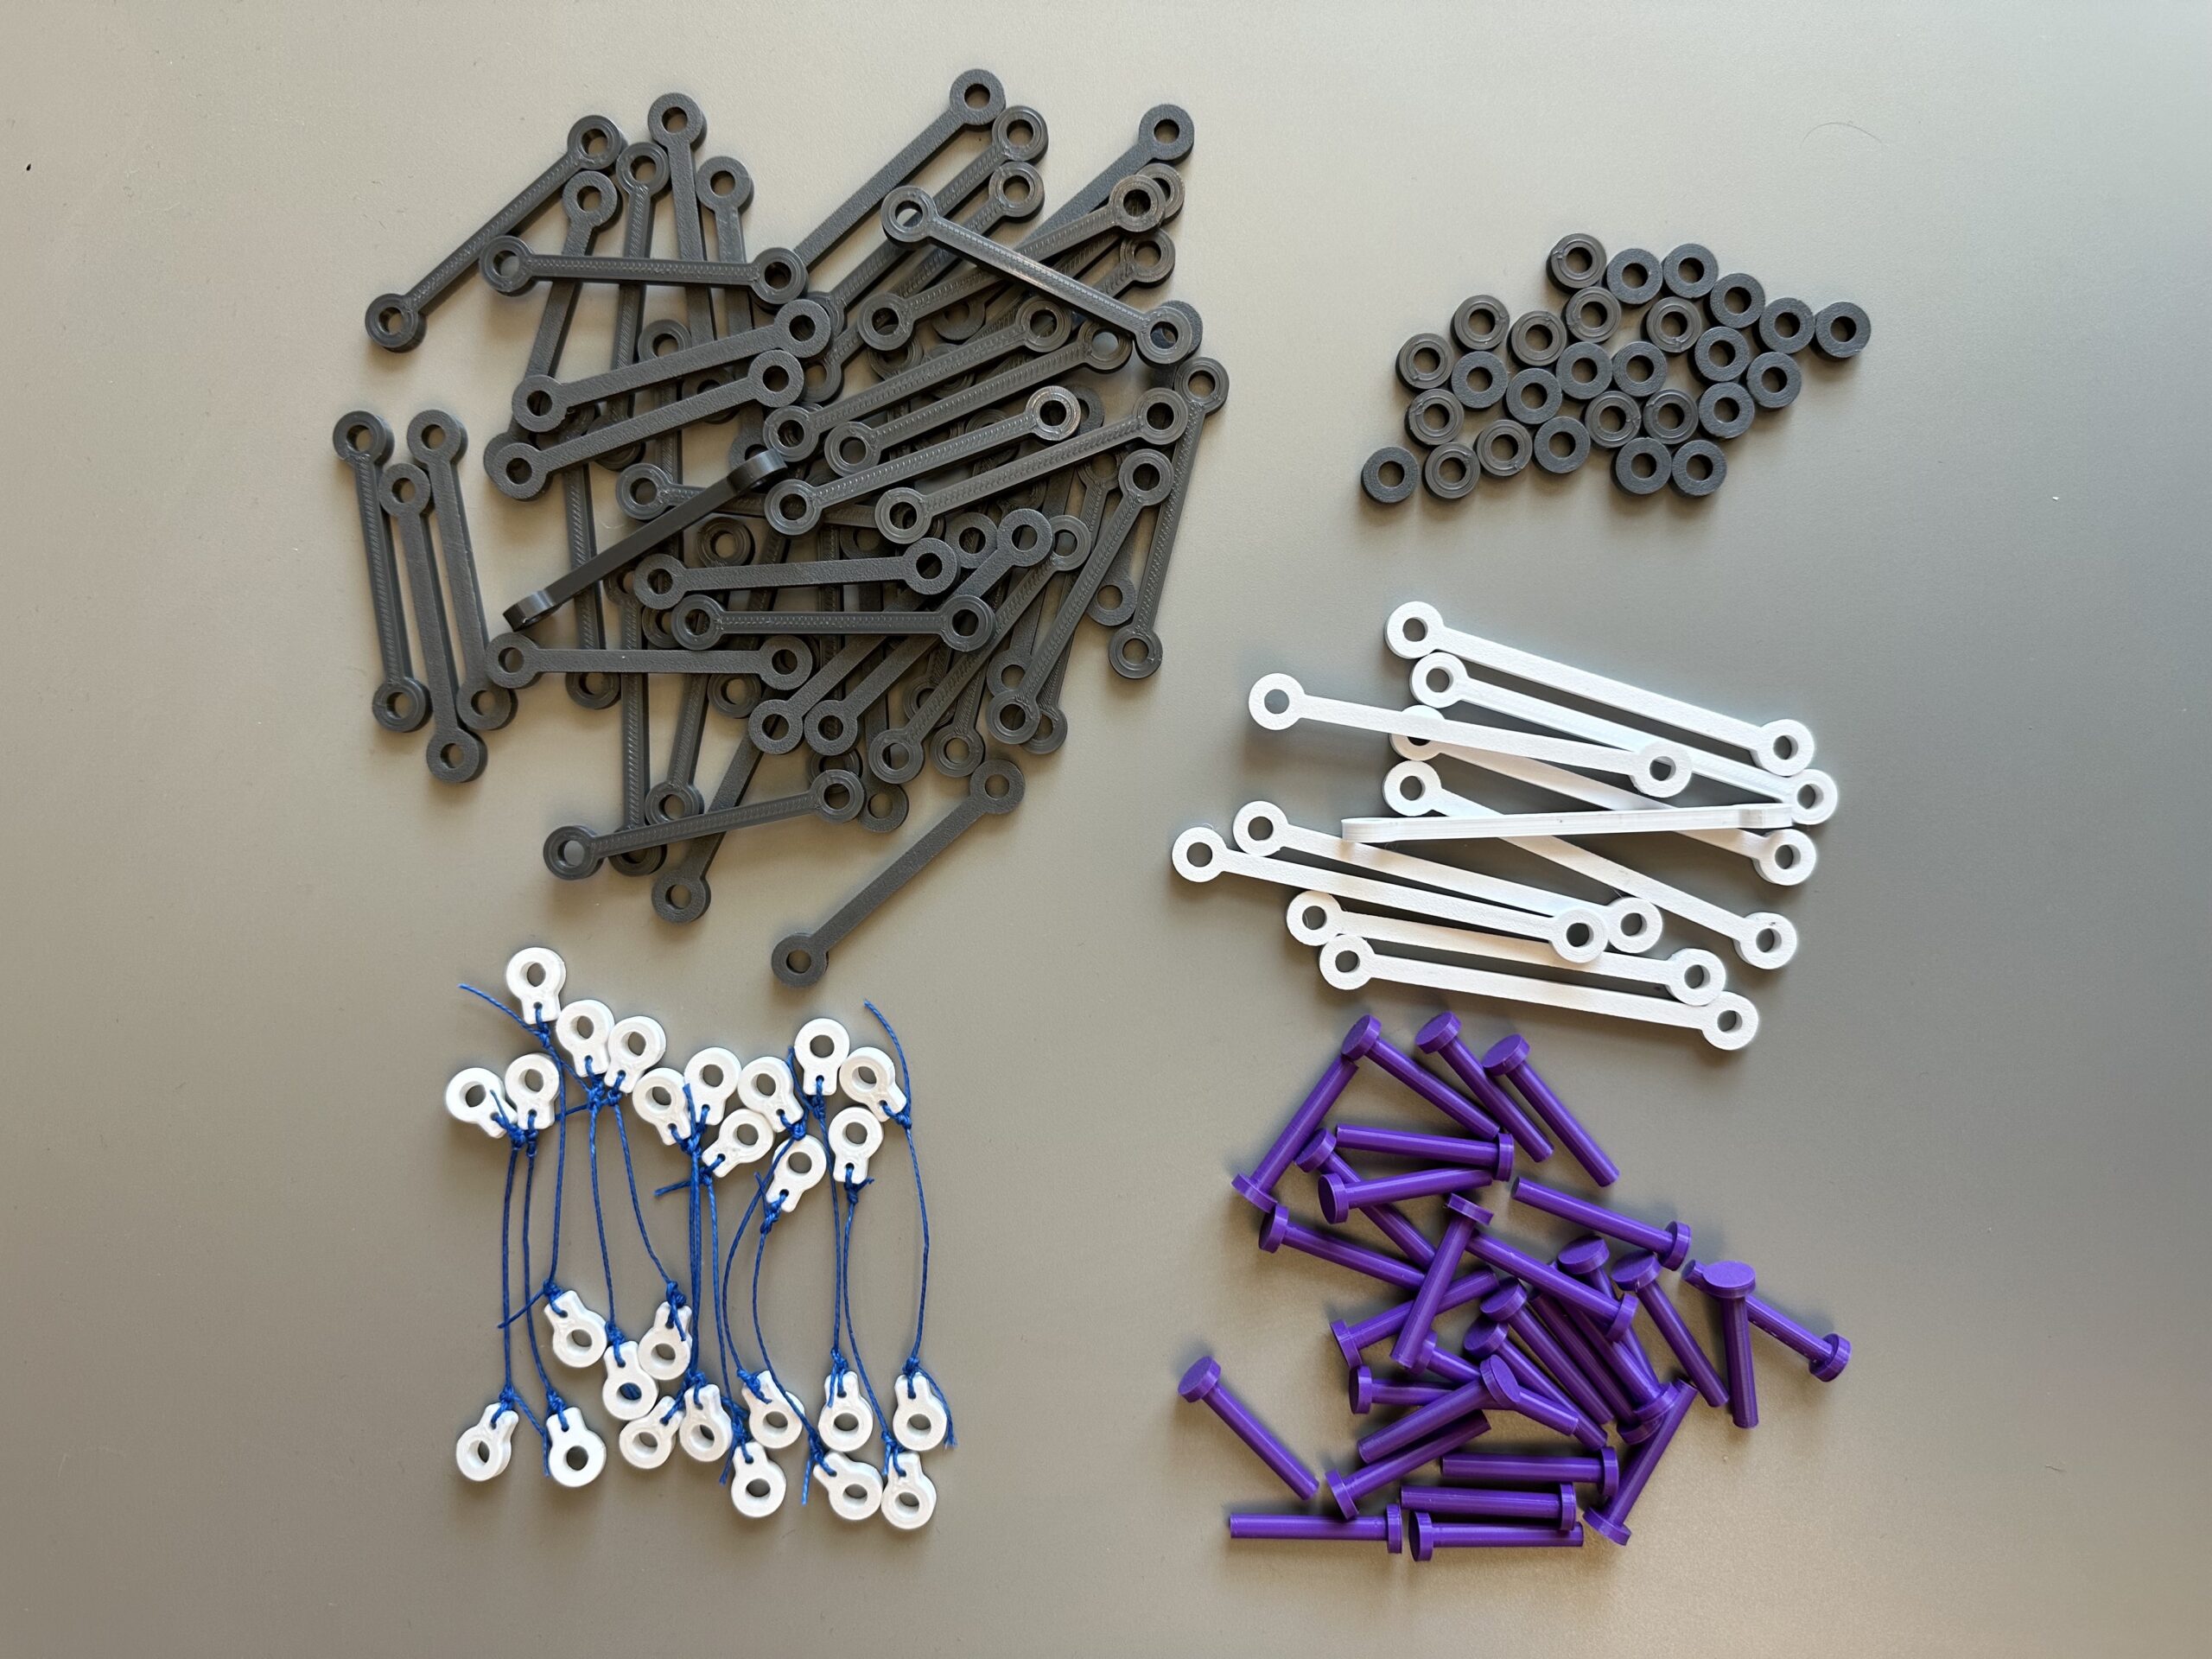
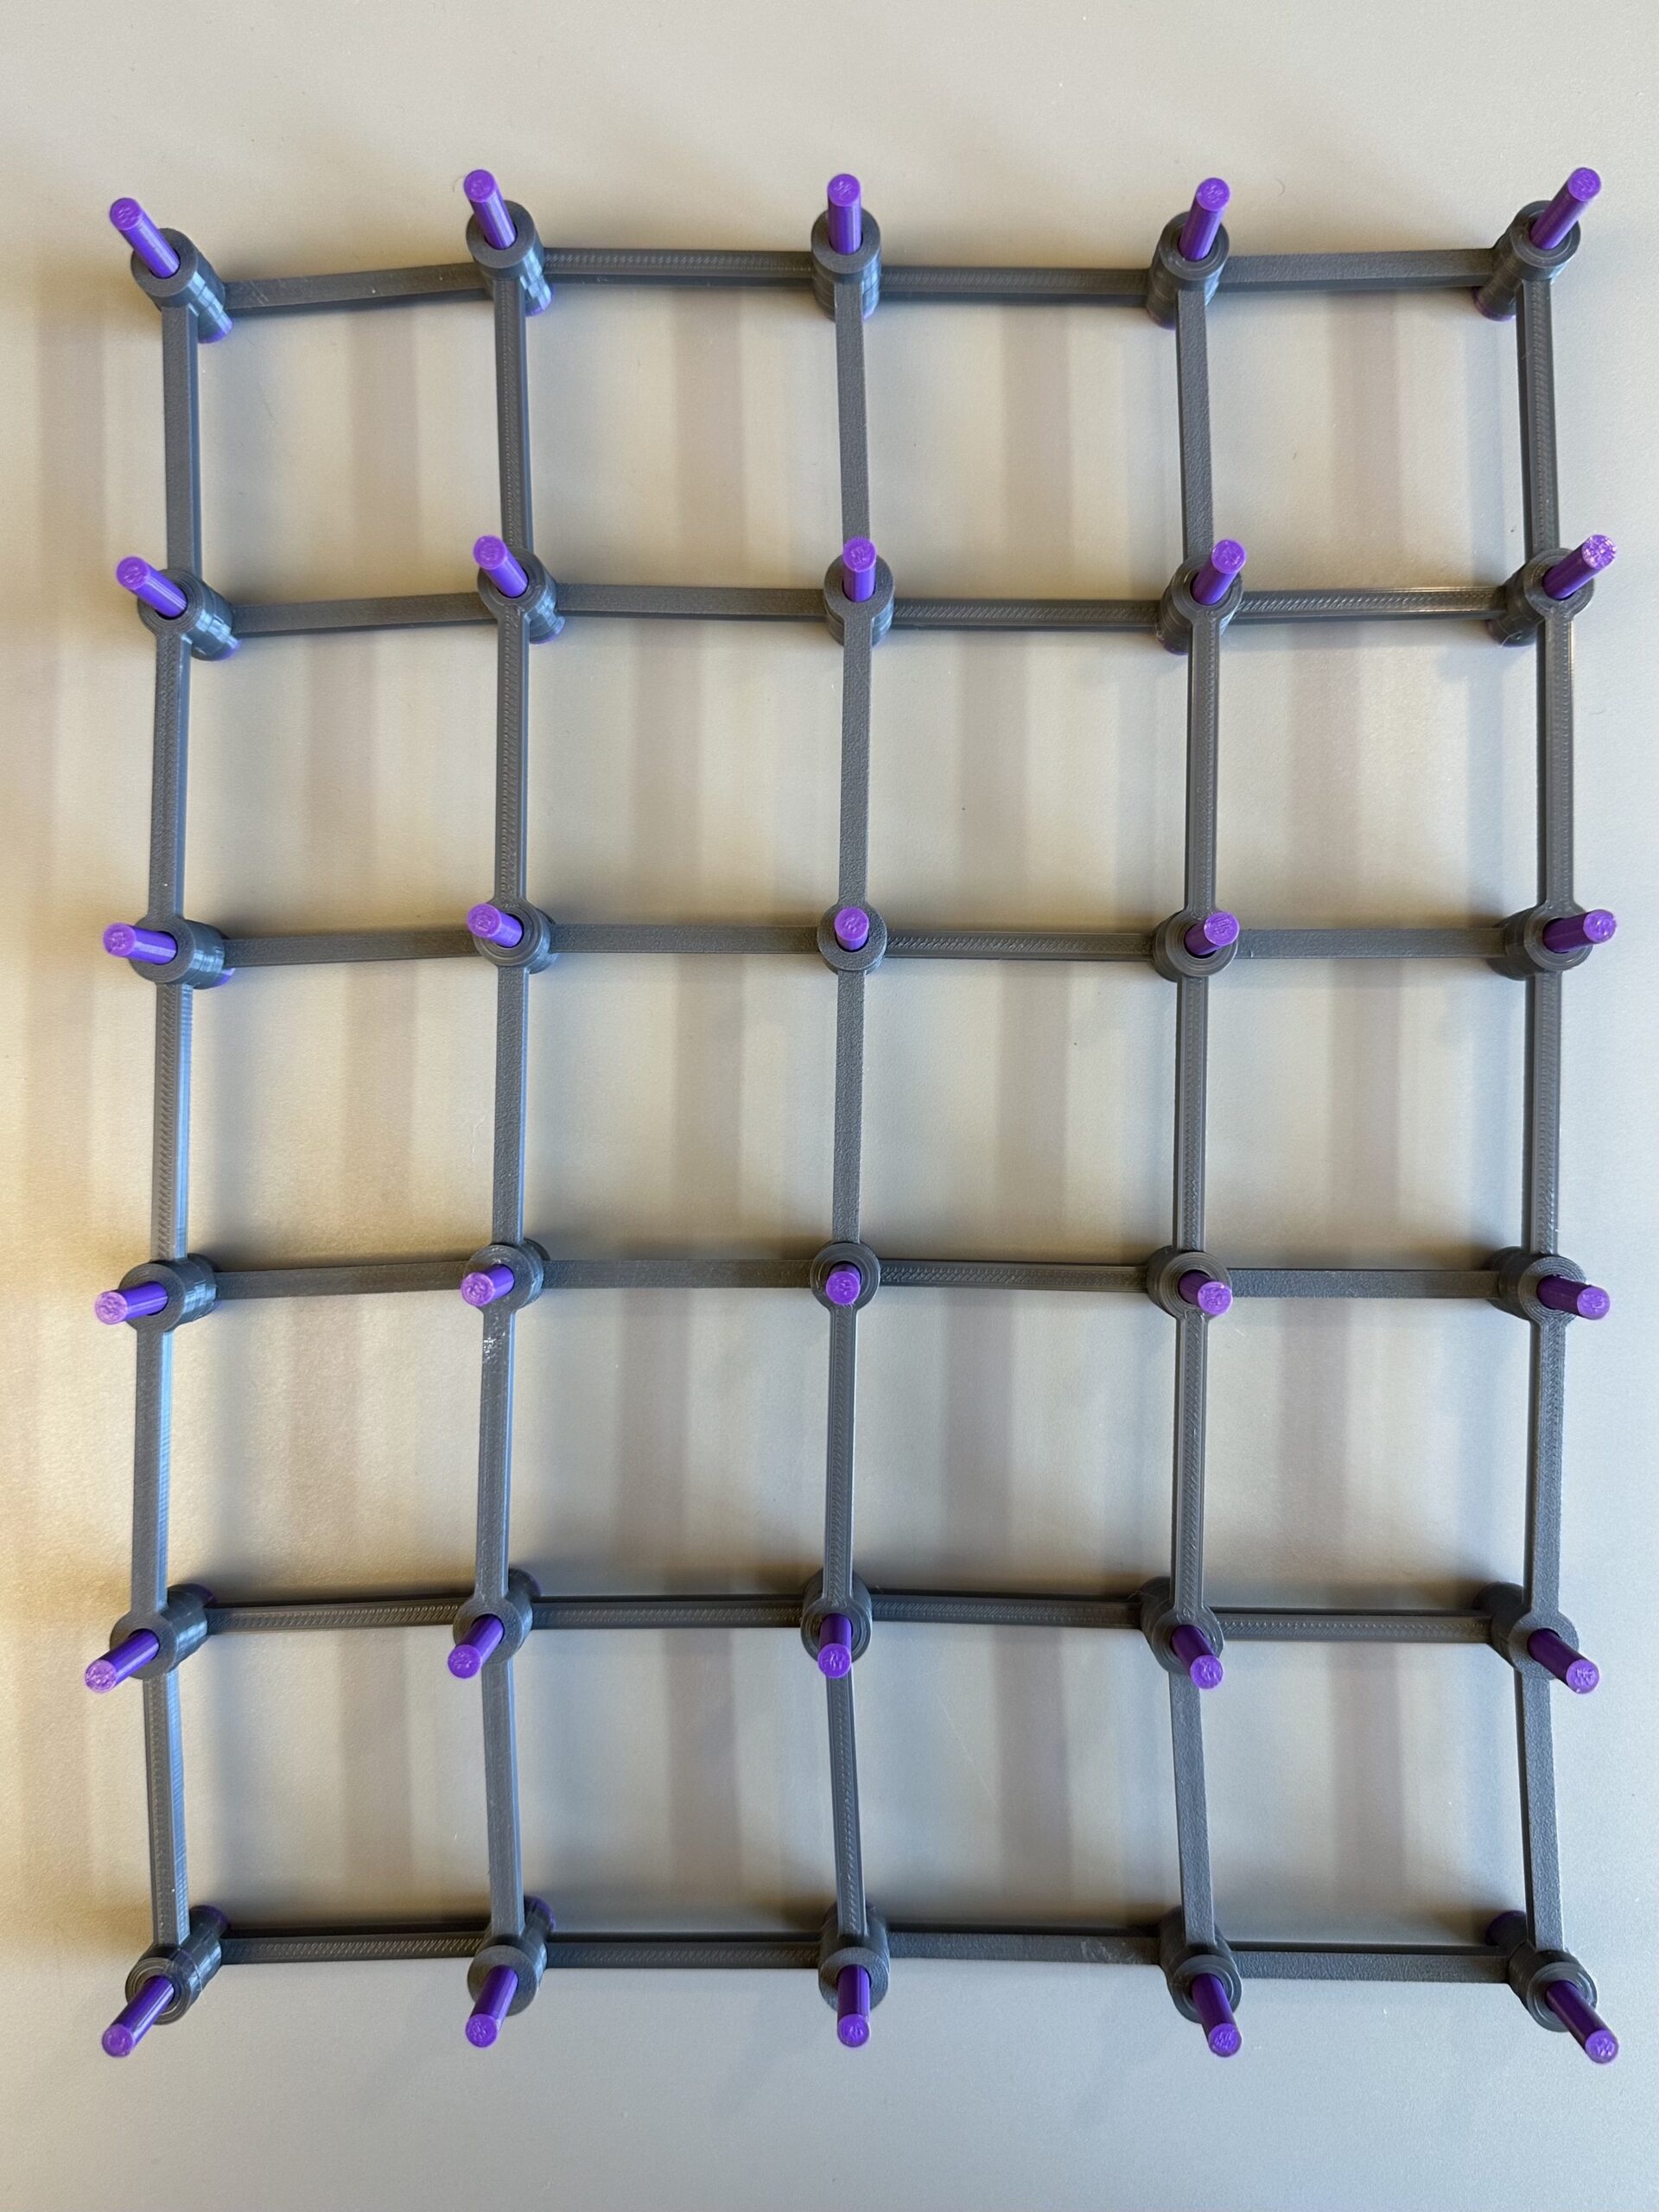
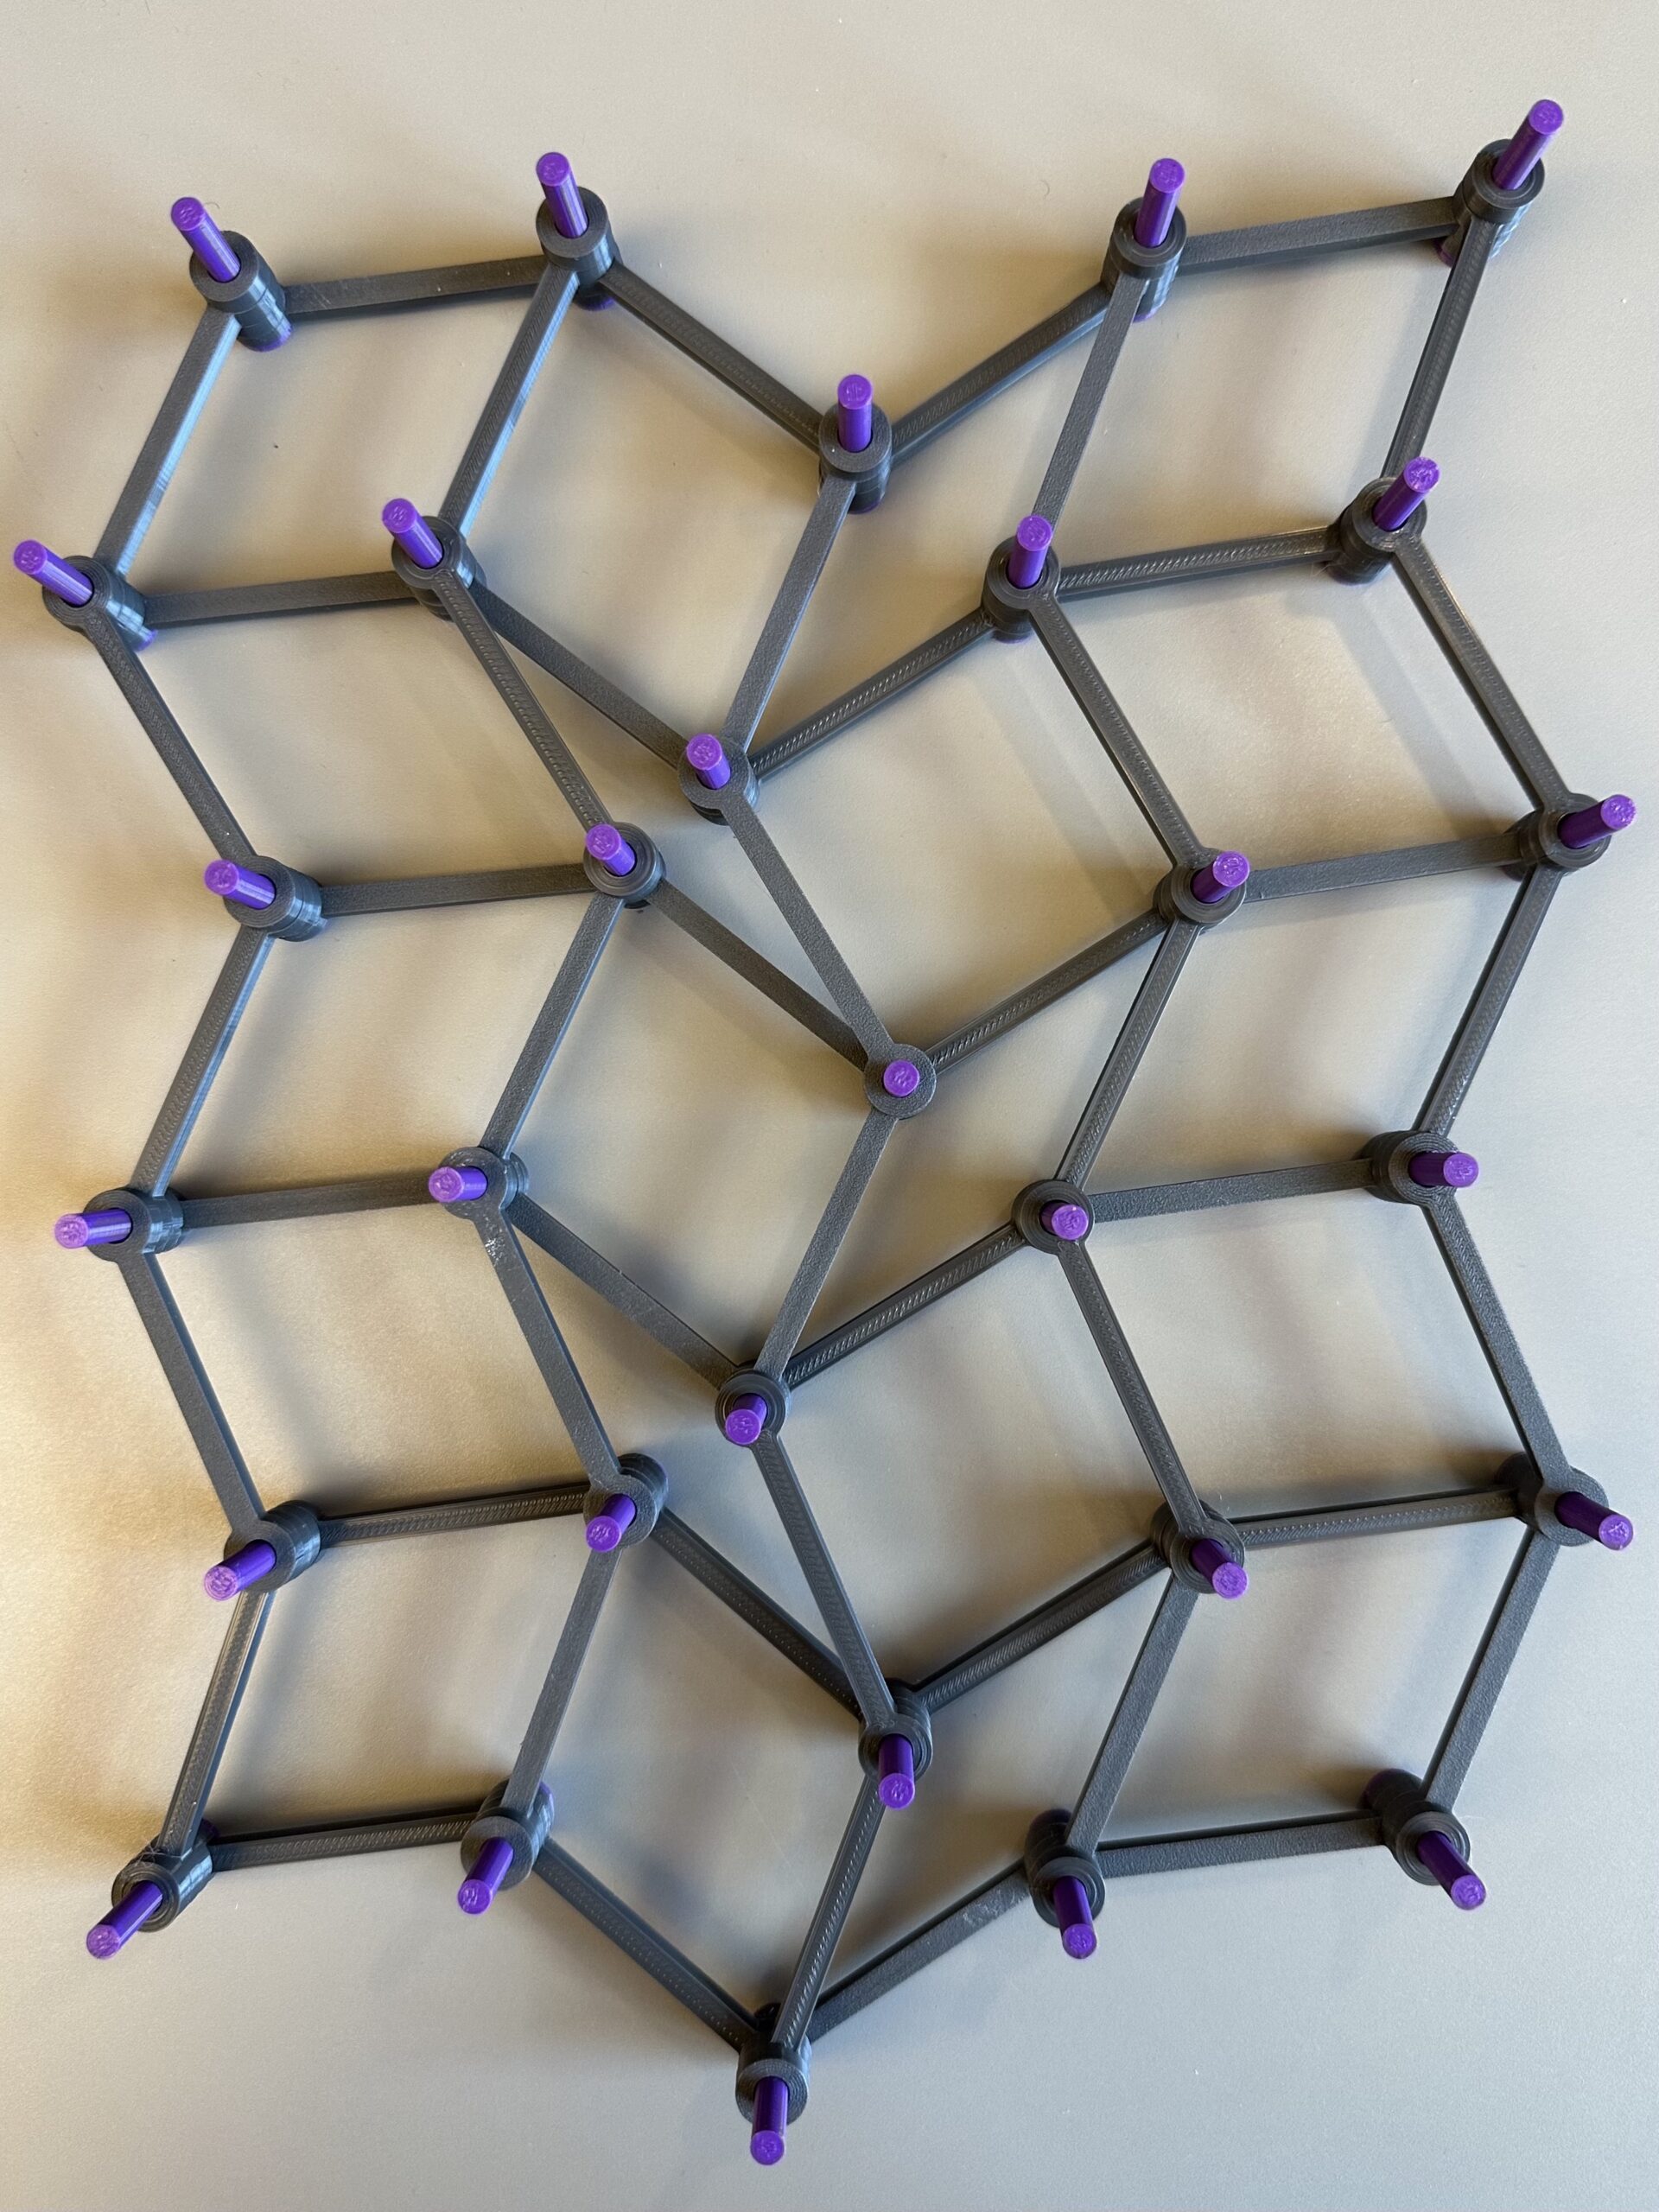
The gray rods slide over the purple pins to form a square grid of any desired size. The photo below shows them assembled into a grid of five squares by four squares. Even though the rods cannot stretch, compress, or bend, they can swivel on the pin joints at every corner, so the structure is not rigid. A light touch distorts the configuration, turning the squares into other rhombuses.
This is where the white beams come in. They are exactly the length of the diagonals of the squares. Placing one of these bracing bars across a square in either direction keeps it from distorting. We could put one crossbeam in every square to make the structure rigid. But can we get by with fewer? If so, where should we place the crossbeams? What is the fewest number needed to stabilize the structure?
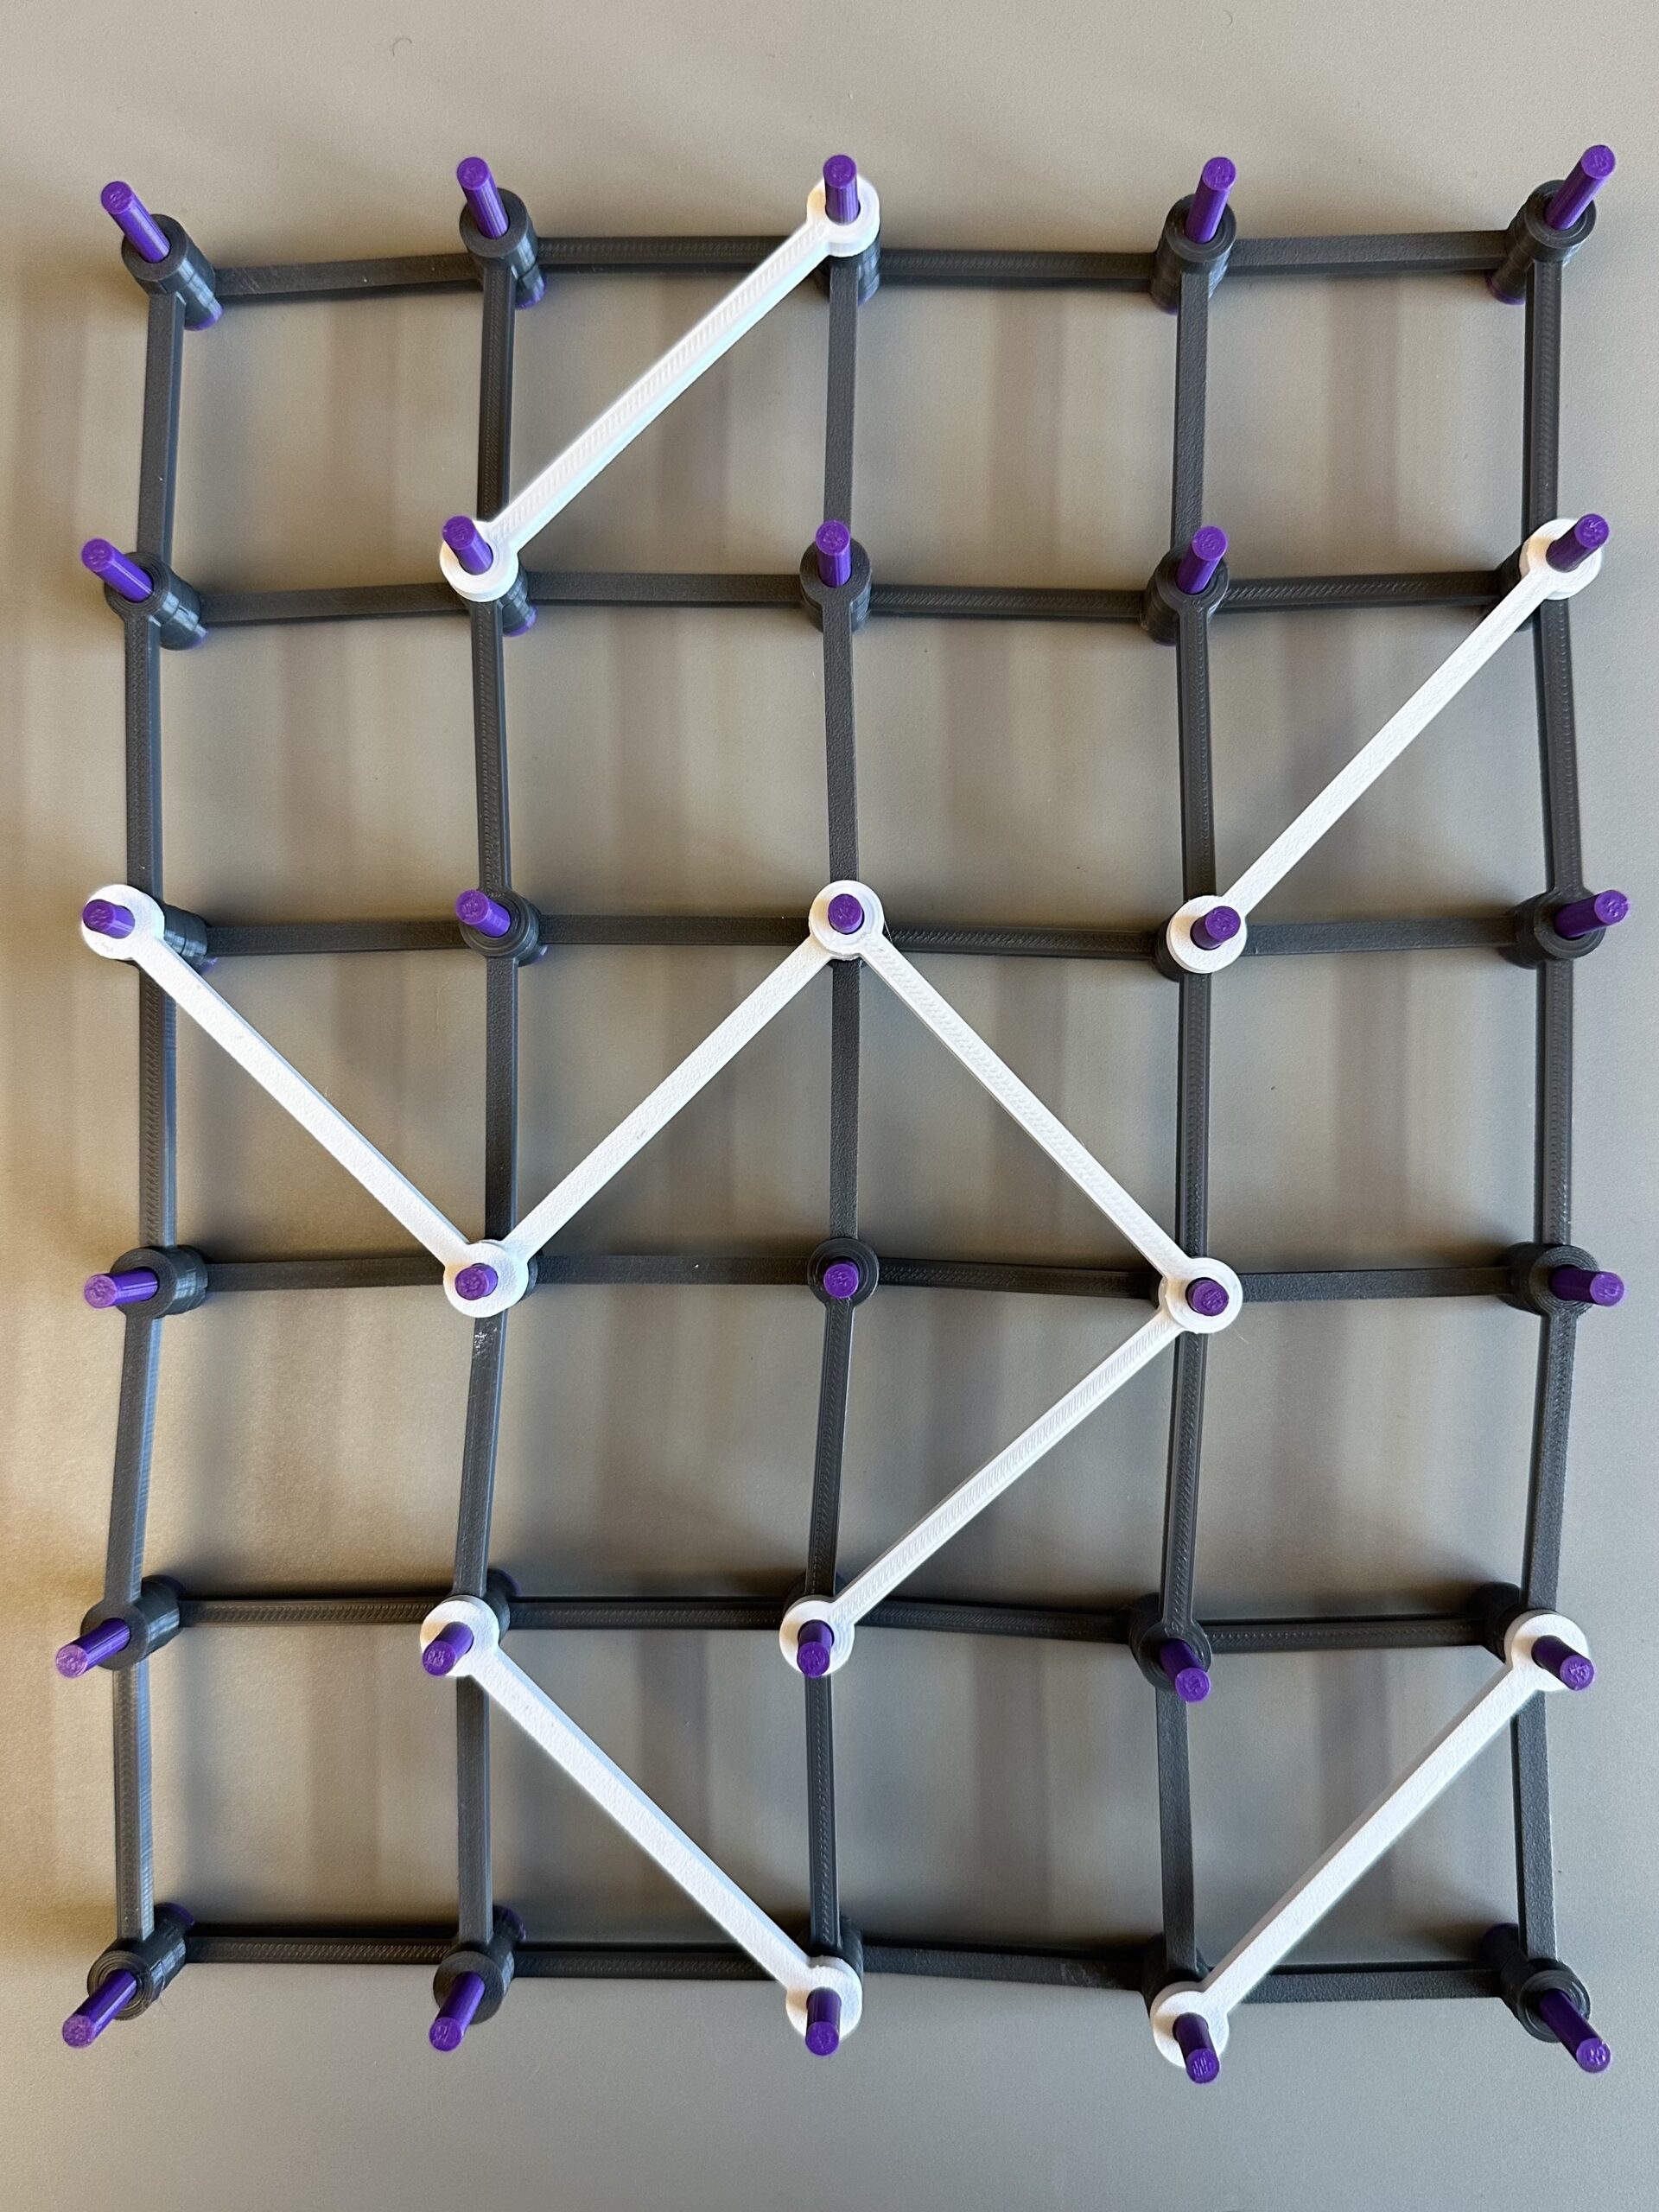
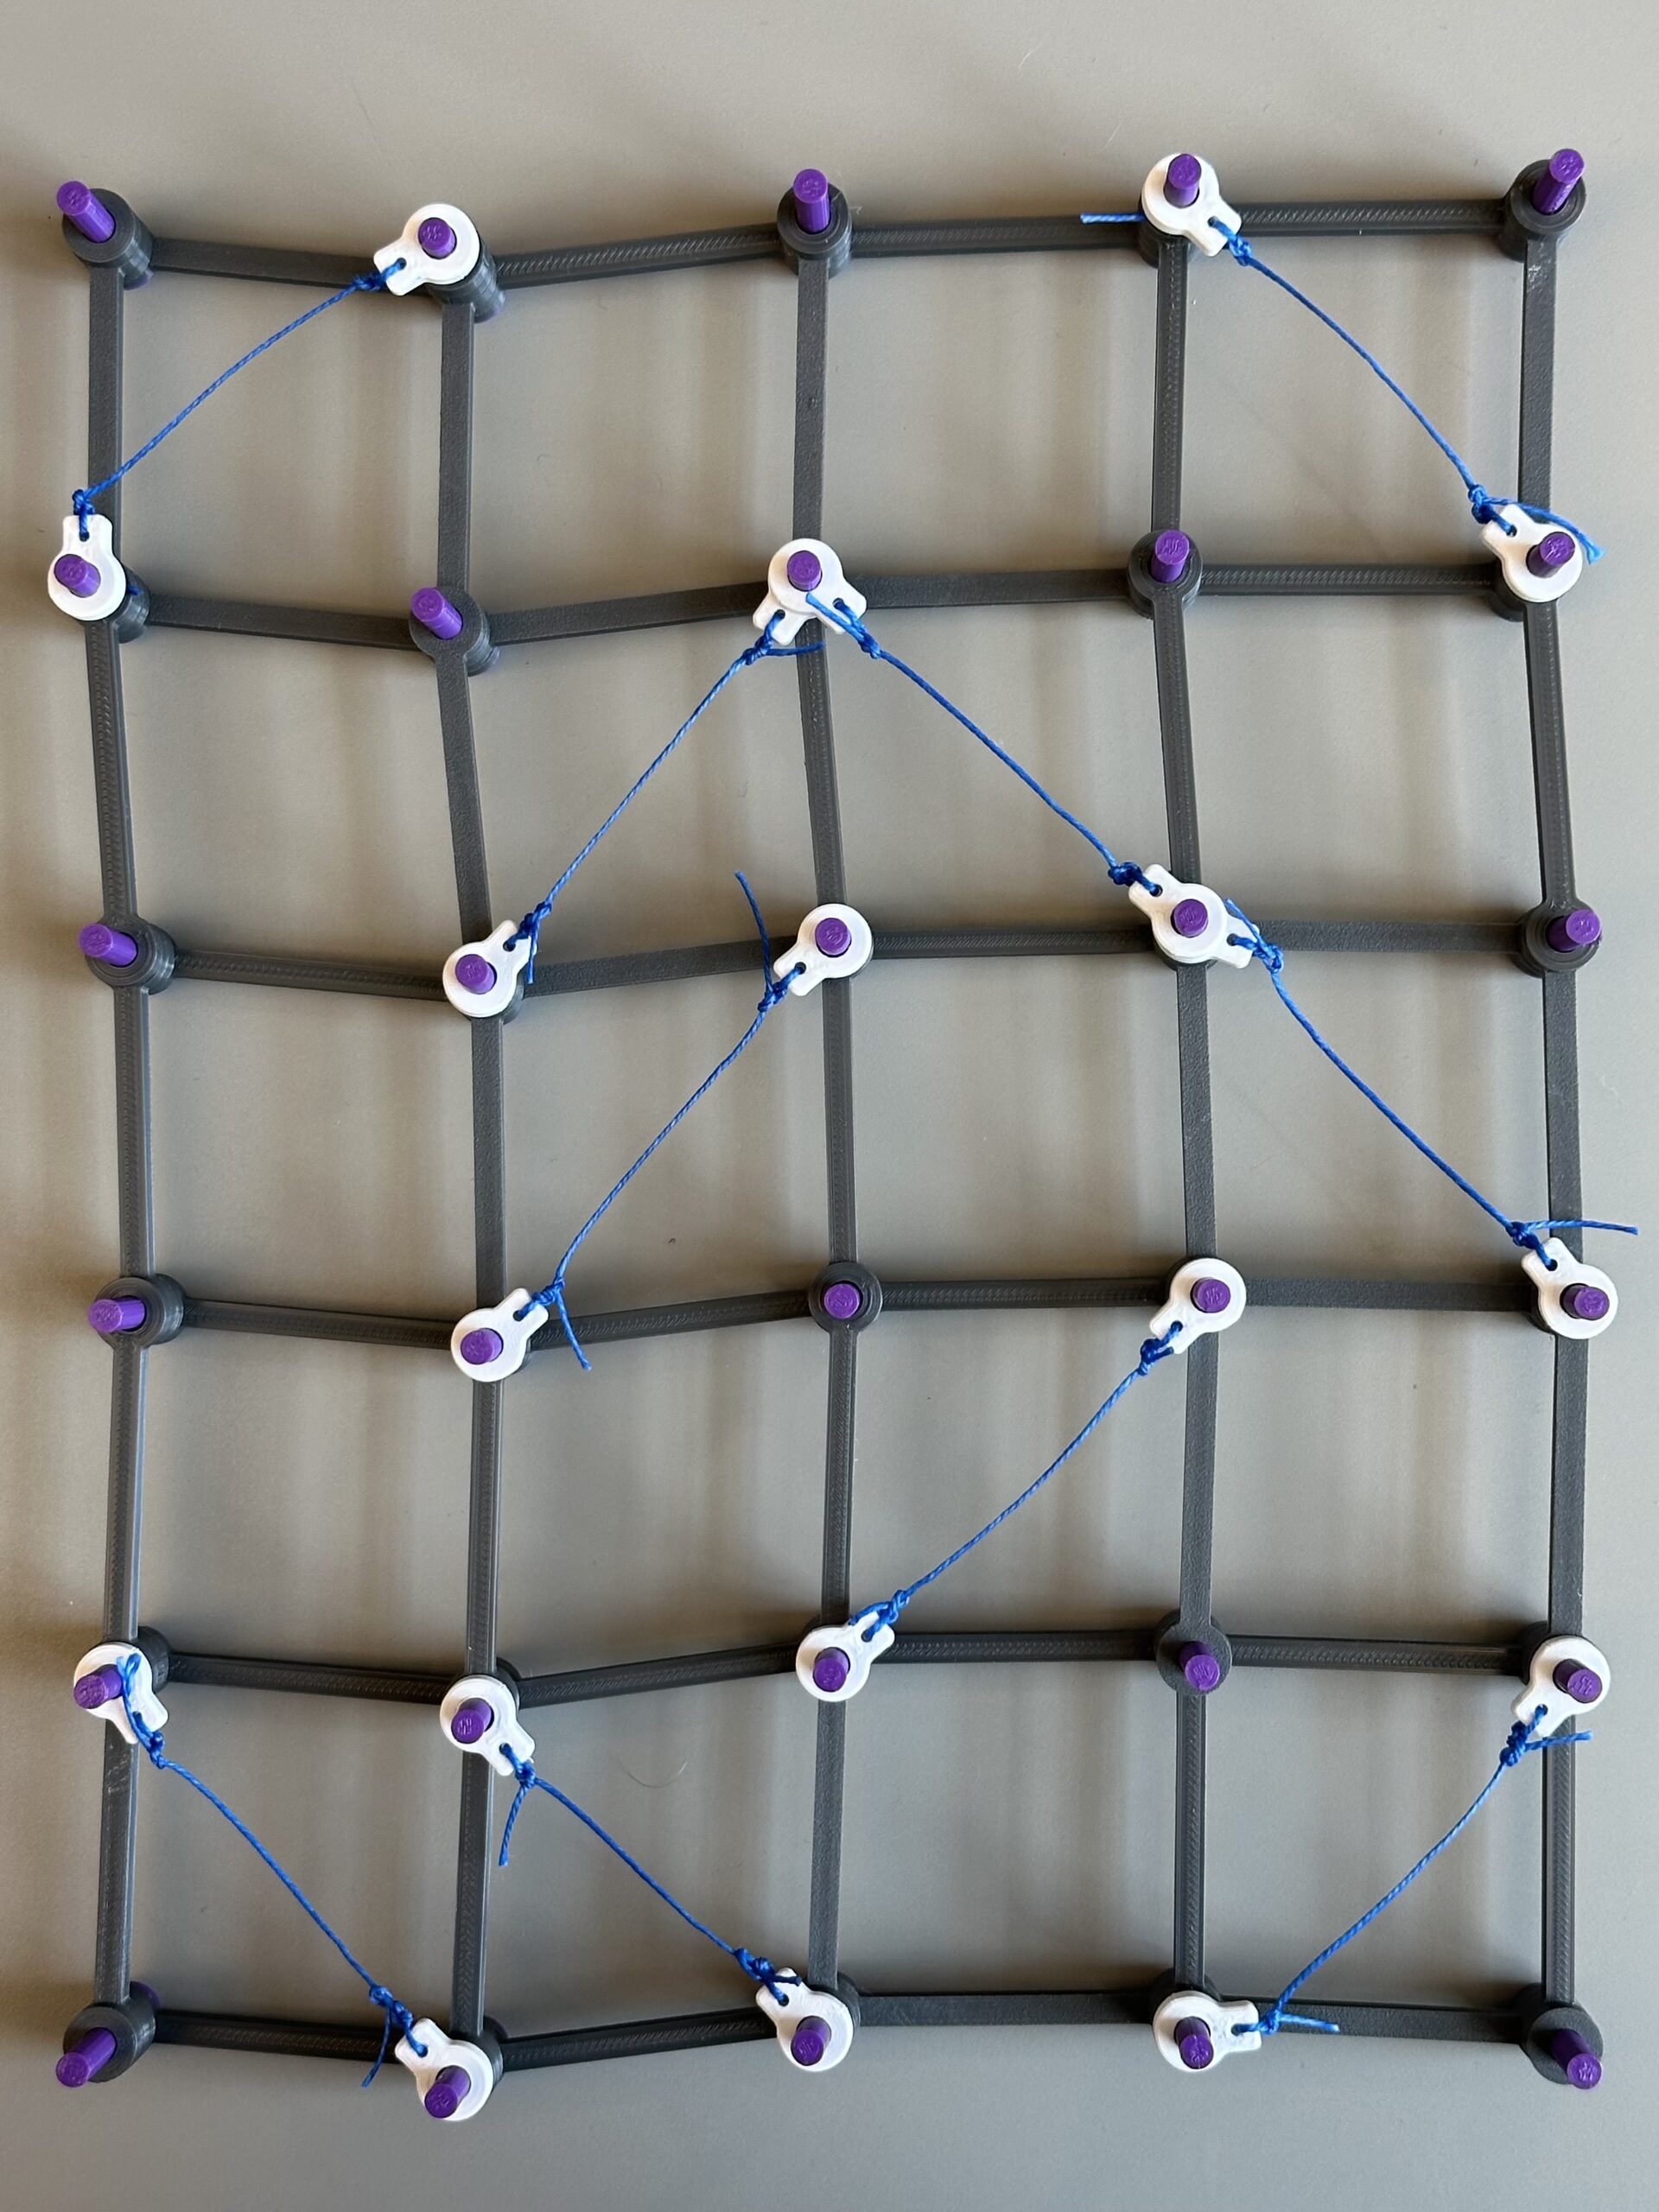
Below, we see two 5 × 4 structures with 10 crossbeams each. Is either one rigid? If it is rigid, does it need all 10 beams?
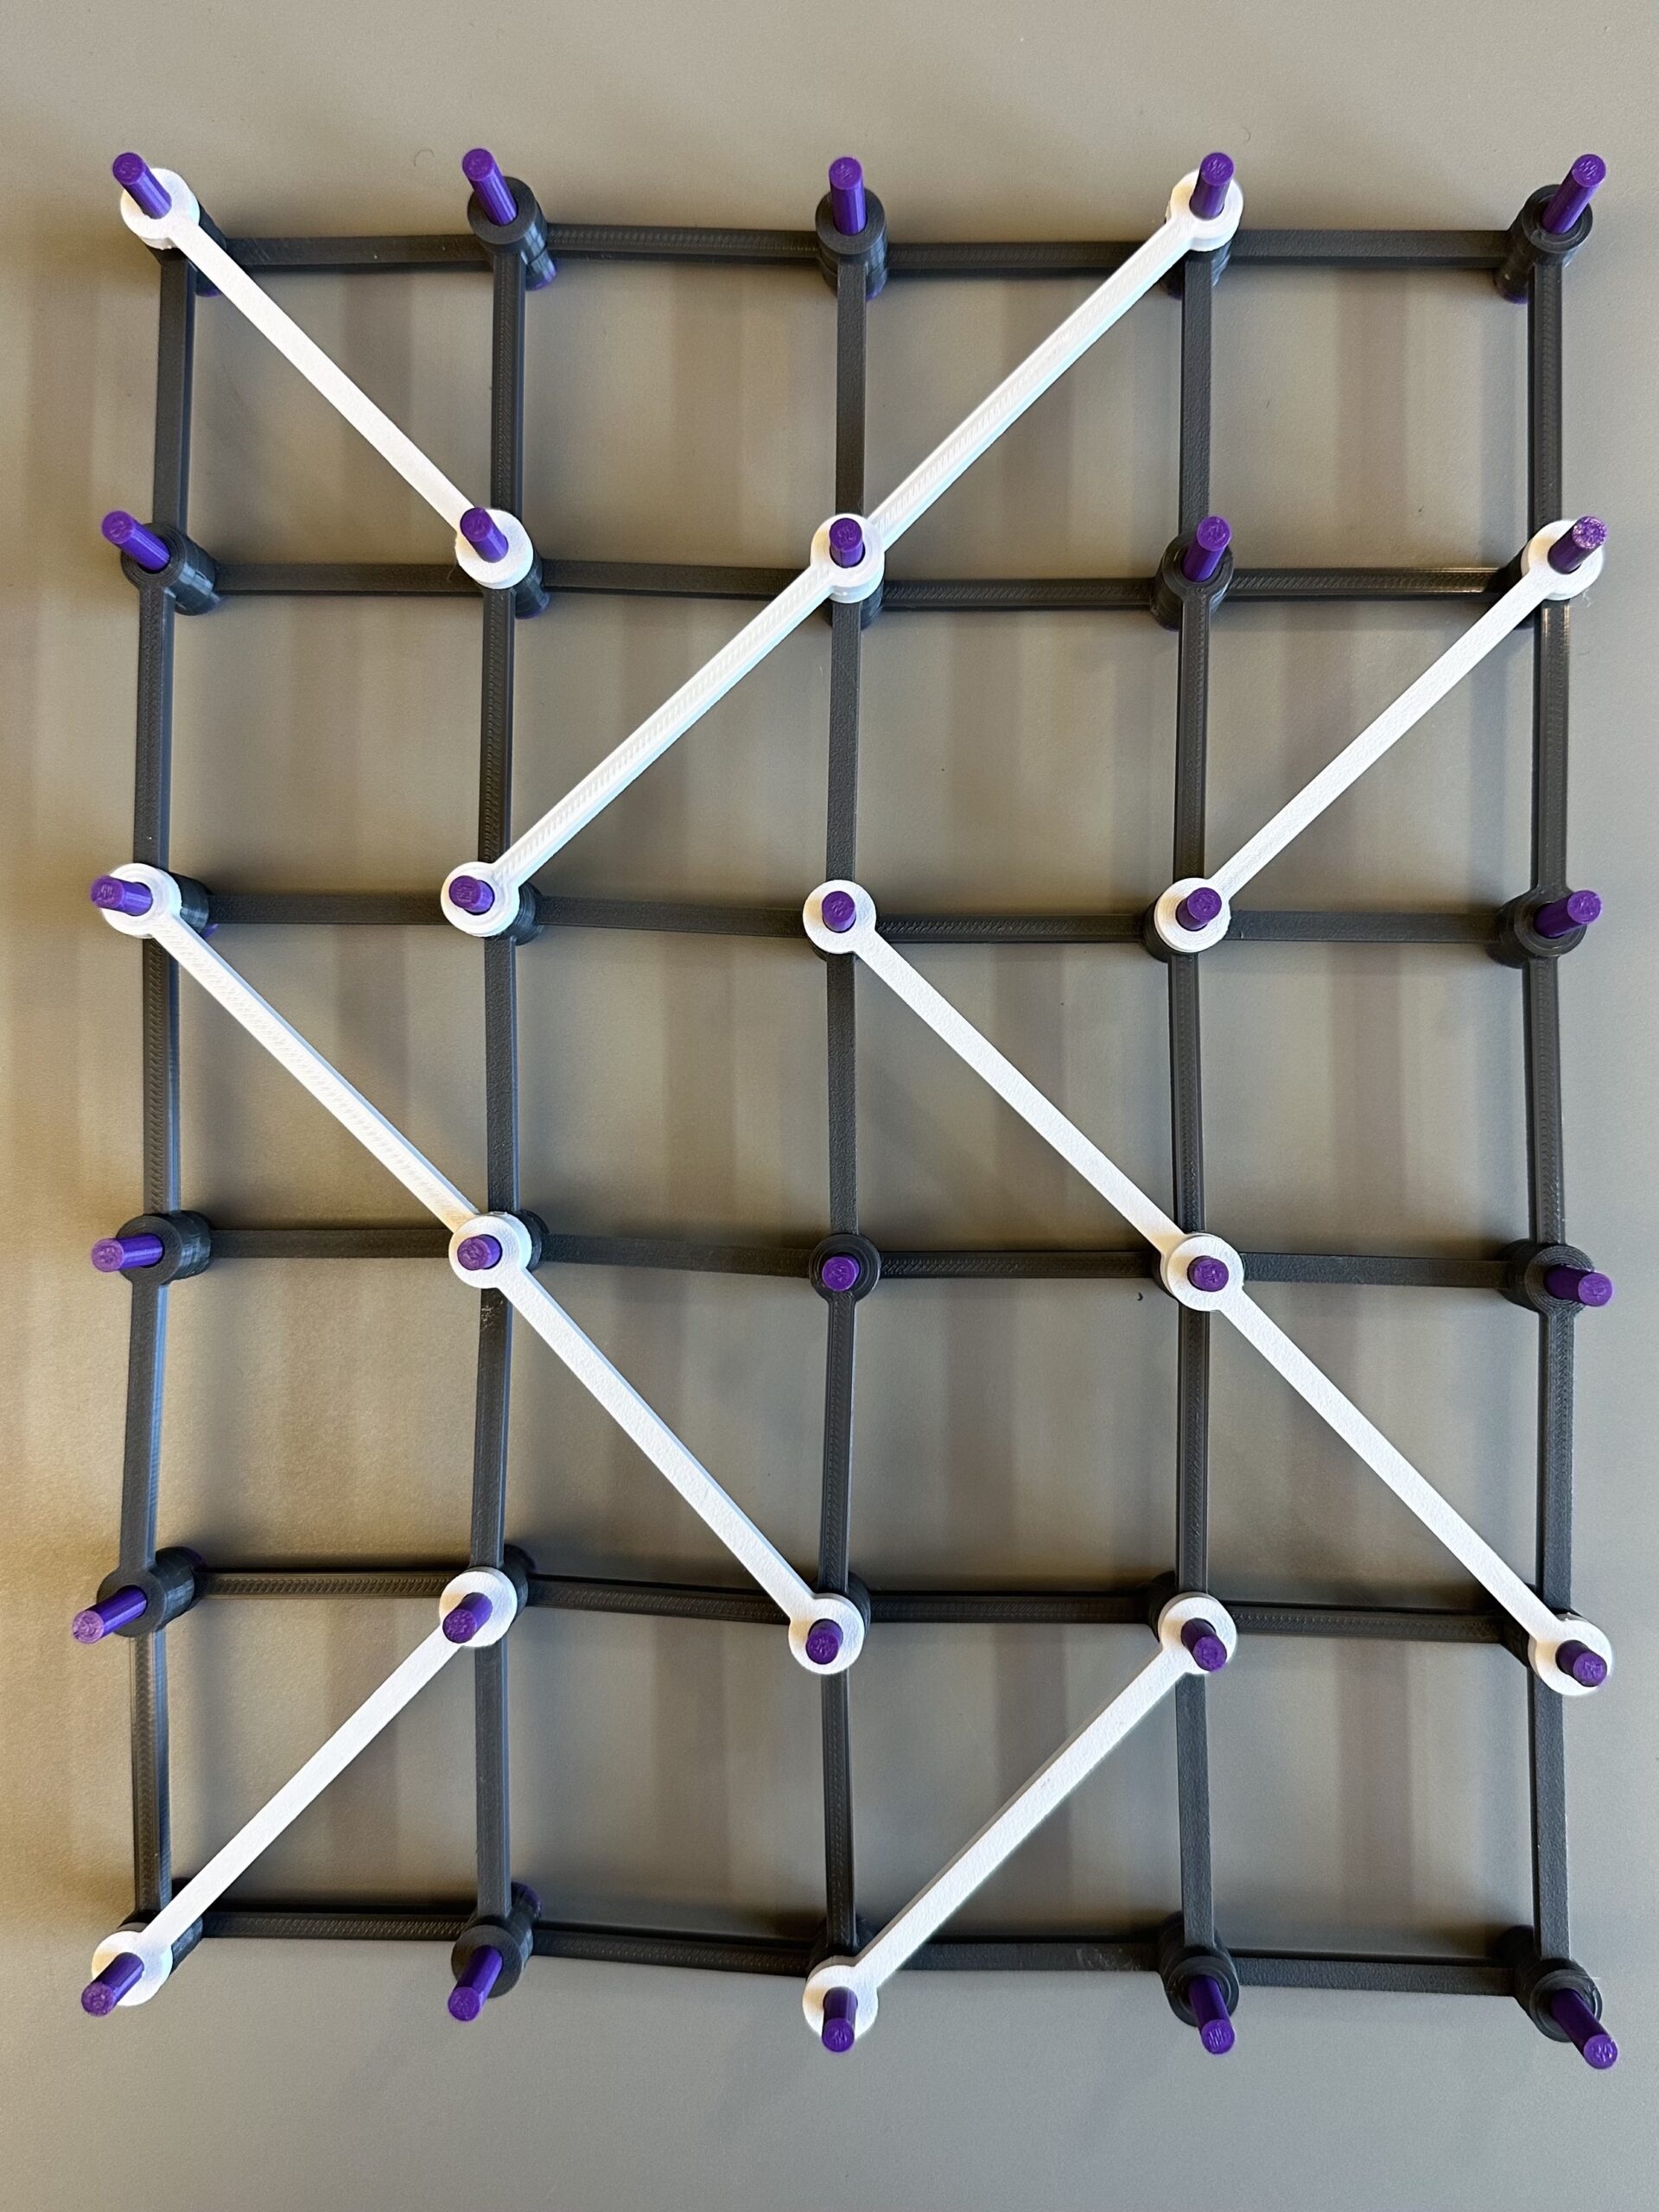
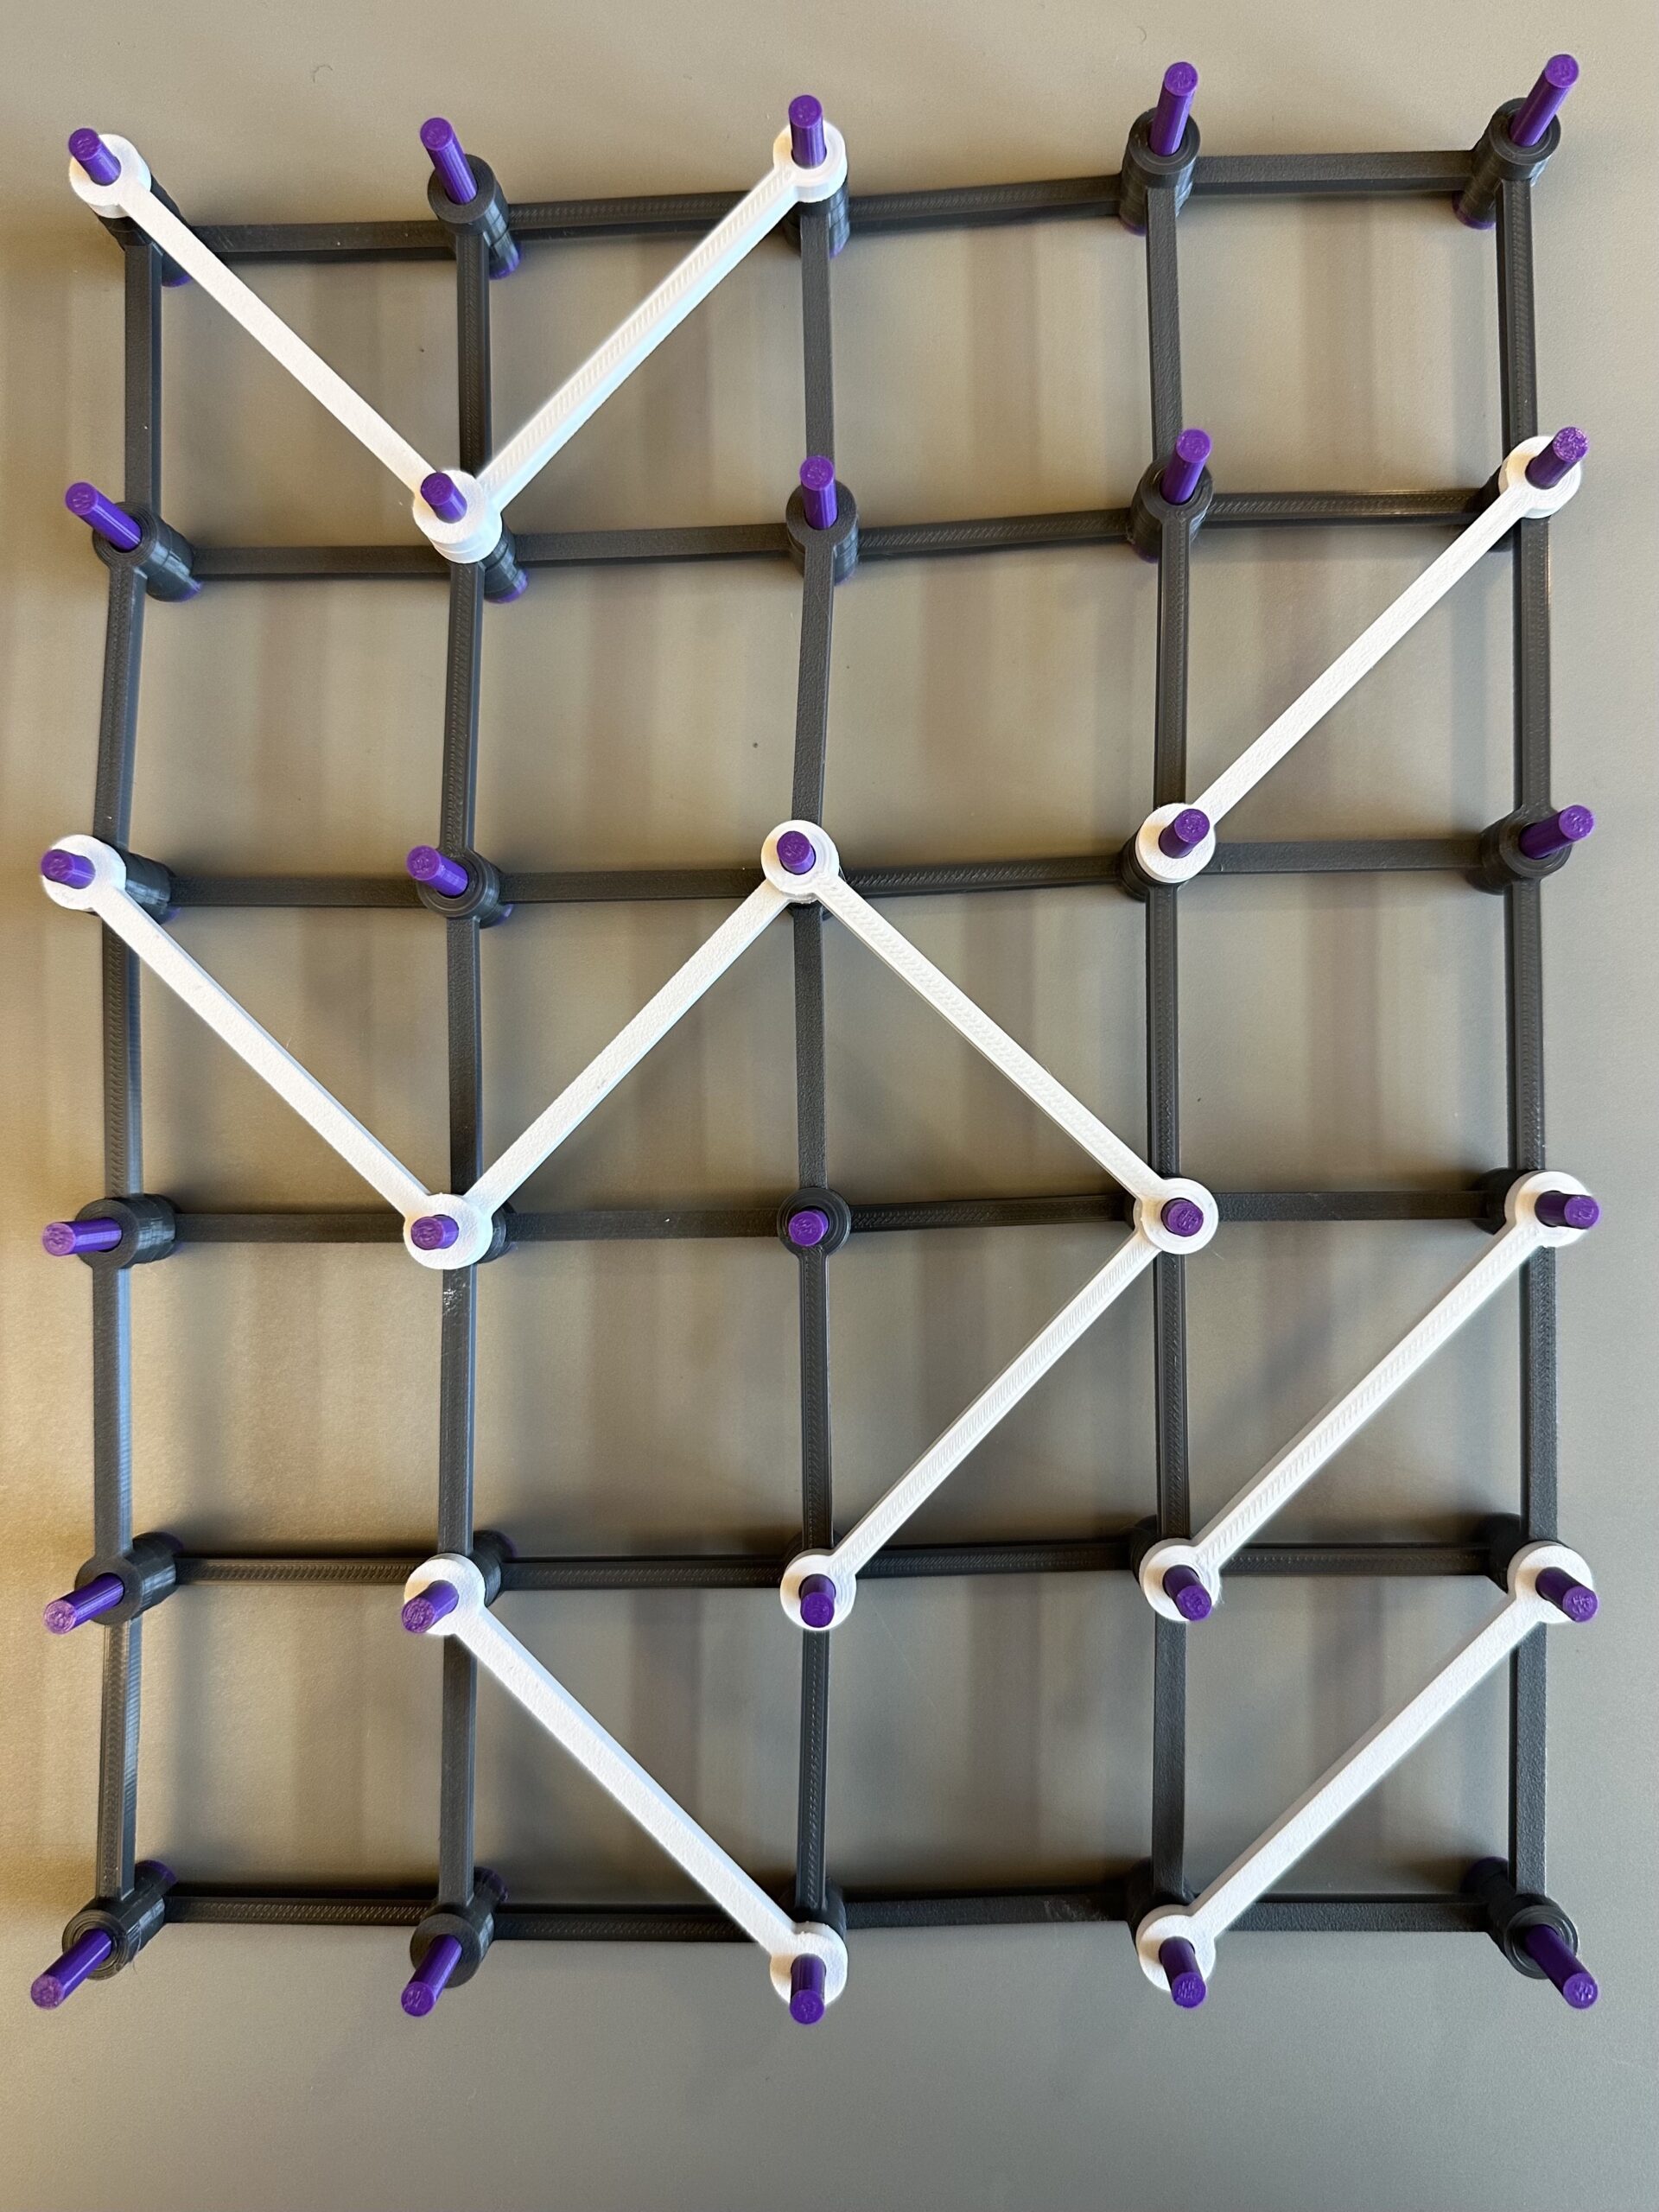
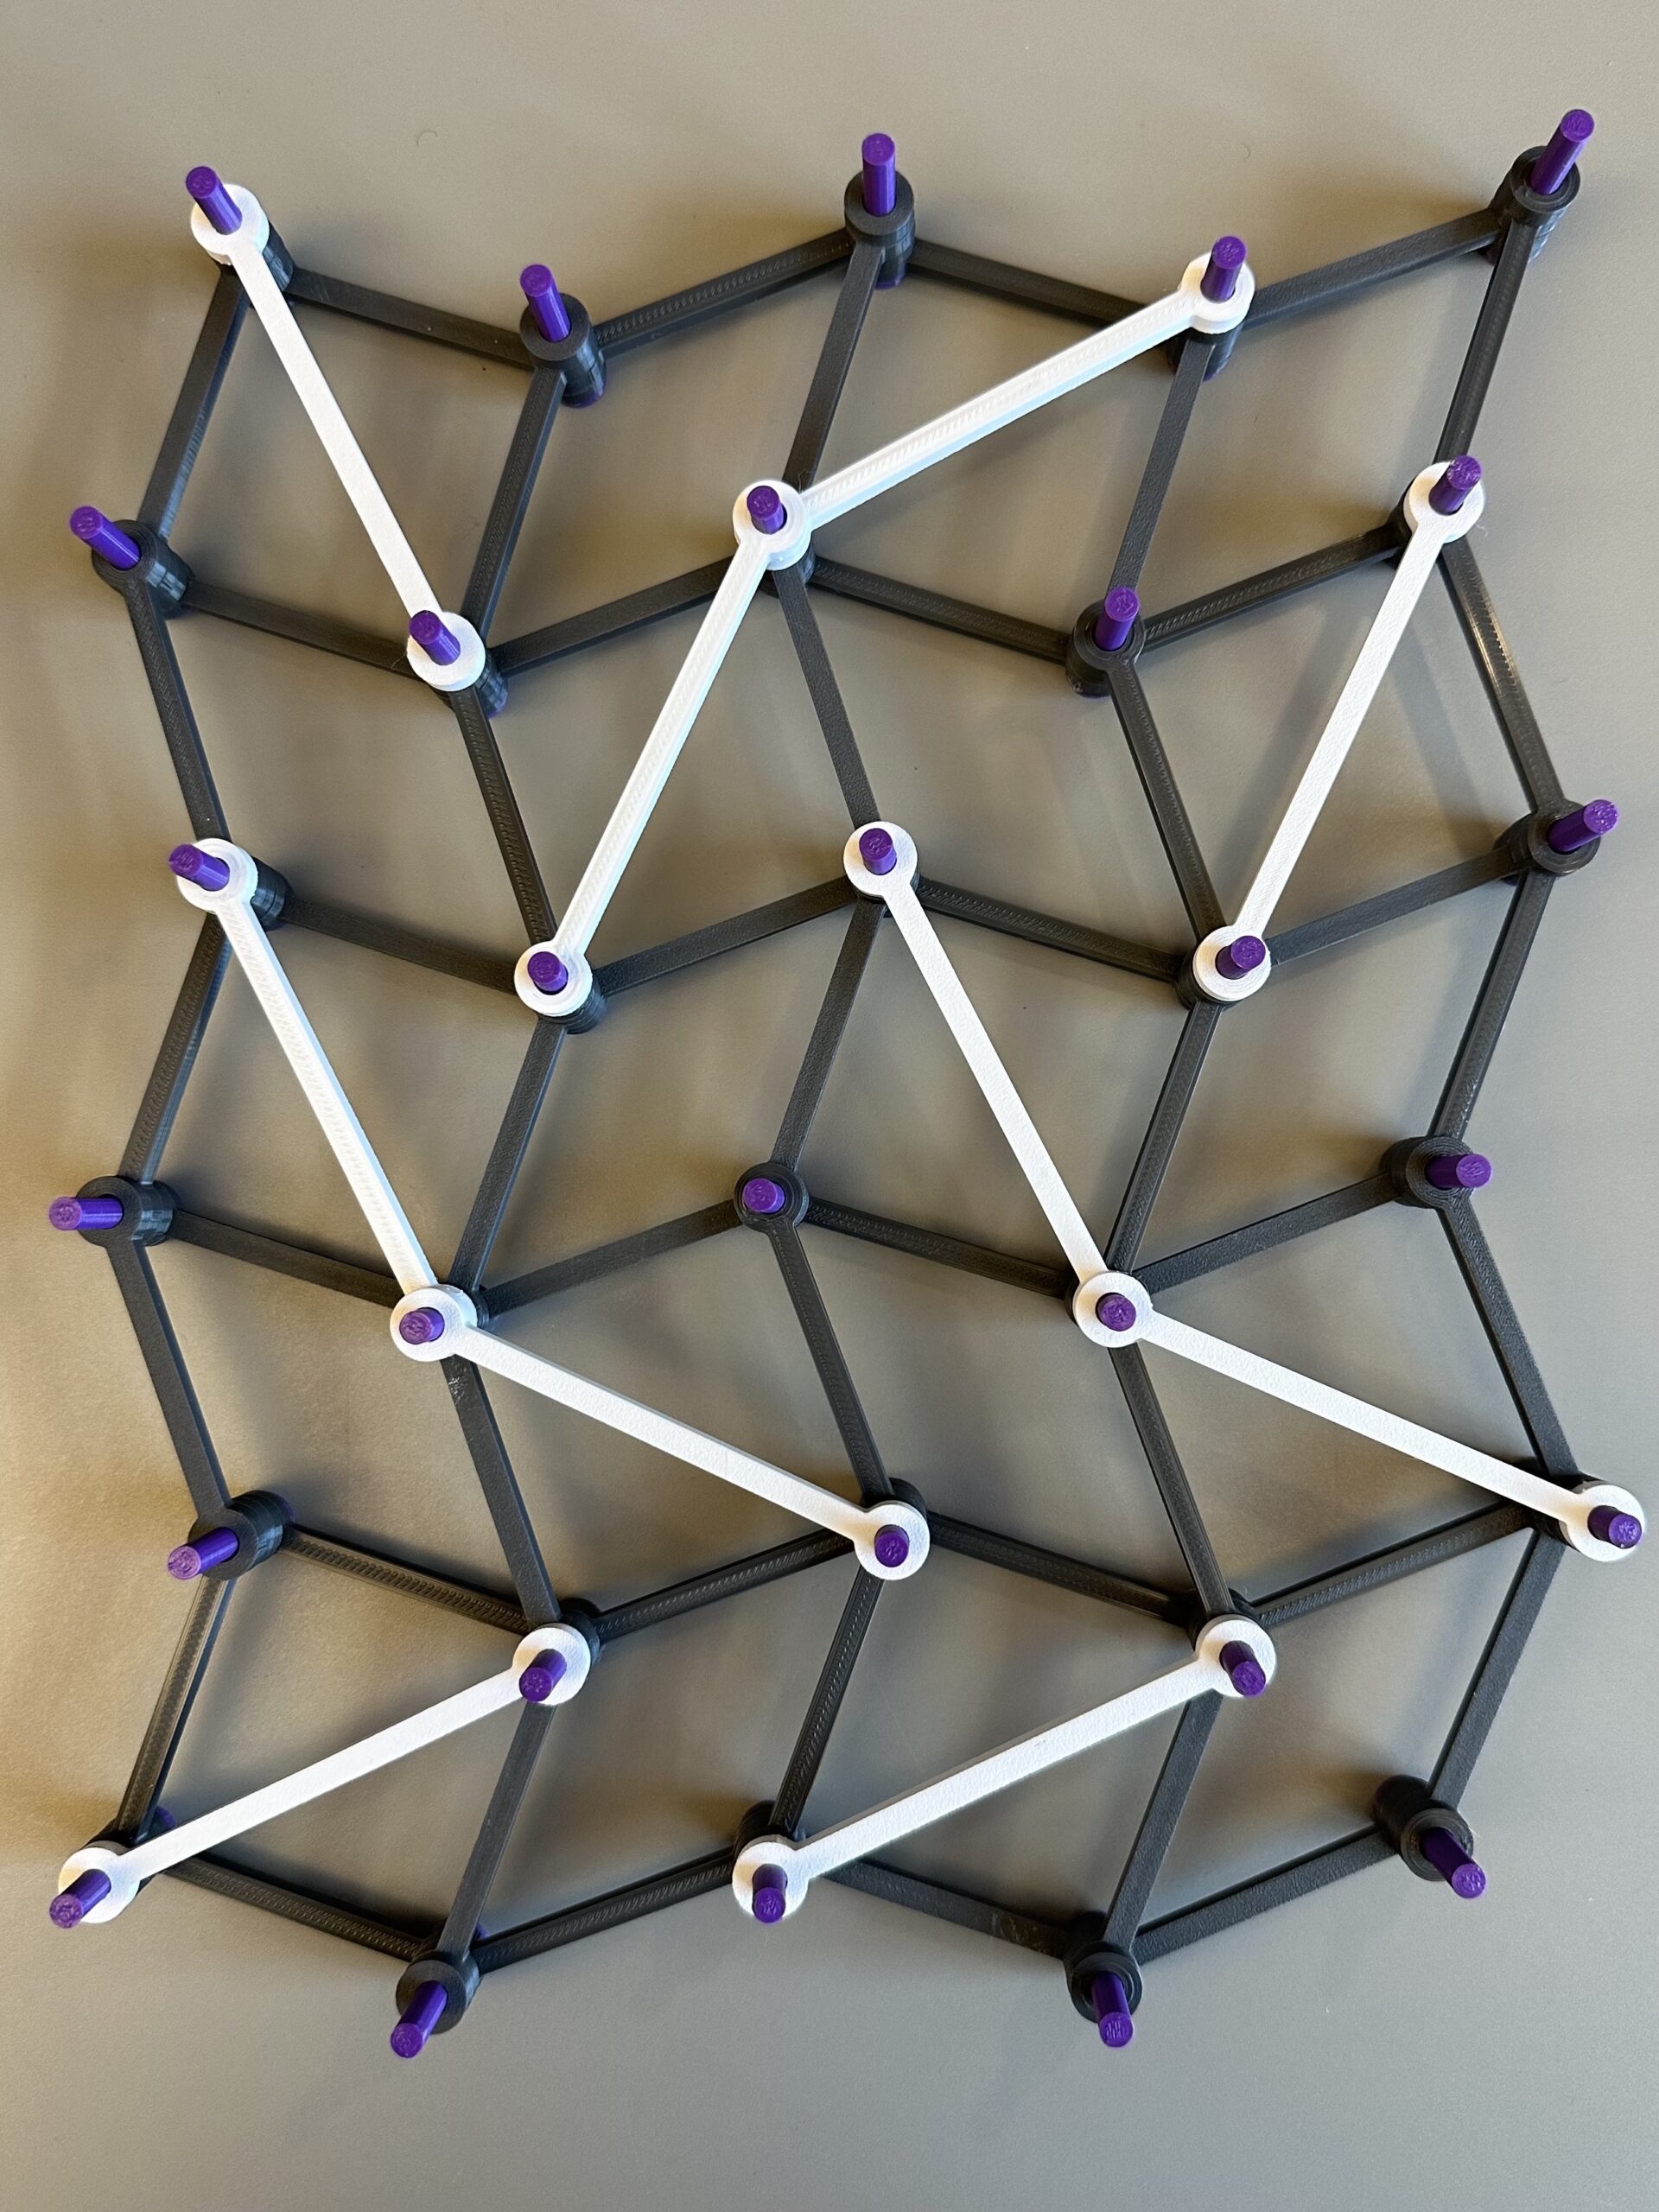
As we see below, the first structure is not a rigid bracing. Although some rhombuses remain square, others are not sufficiently braced to keep their original shape. However, the second bracing is rigid, and in fact, it is overbraced. We can remove two beams and still have a rigid bracing, also shown below.
As it turns out, there is a straightforward way to determine if a bracing is rigid, but it requires some basic ideas from graph theory.
The first thing to observe is that in any braced structure—rigid or deformed—all the vertical bars in a row are parallel, and all the horizontal bars in a column are parallel. We can see that in the deformed structure above.
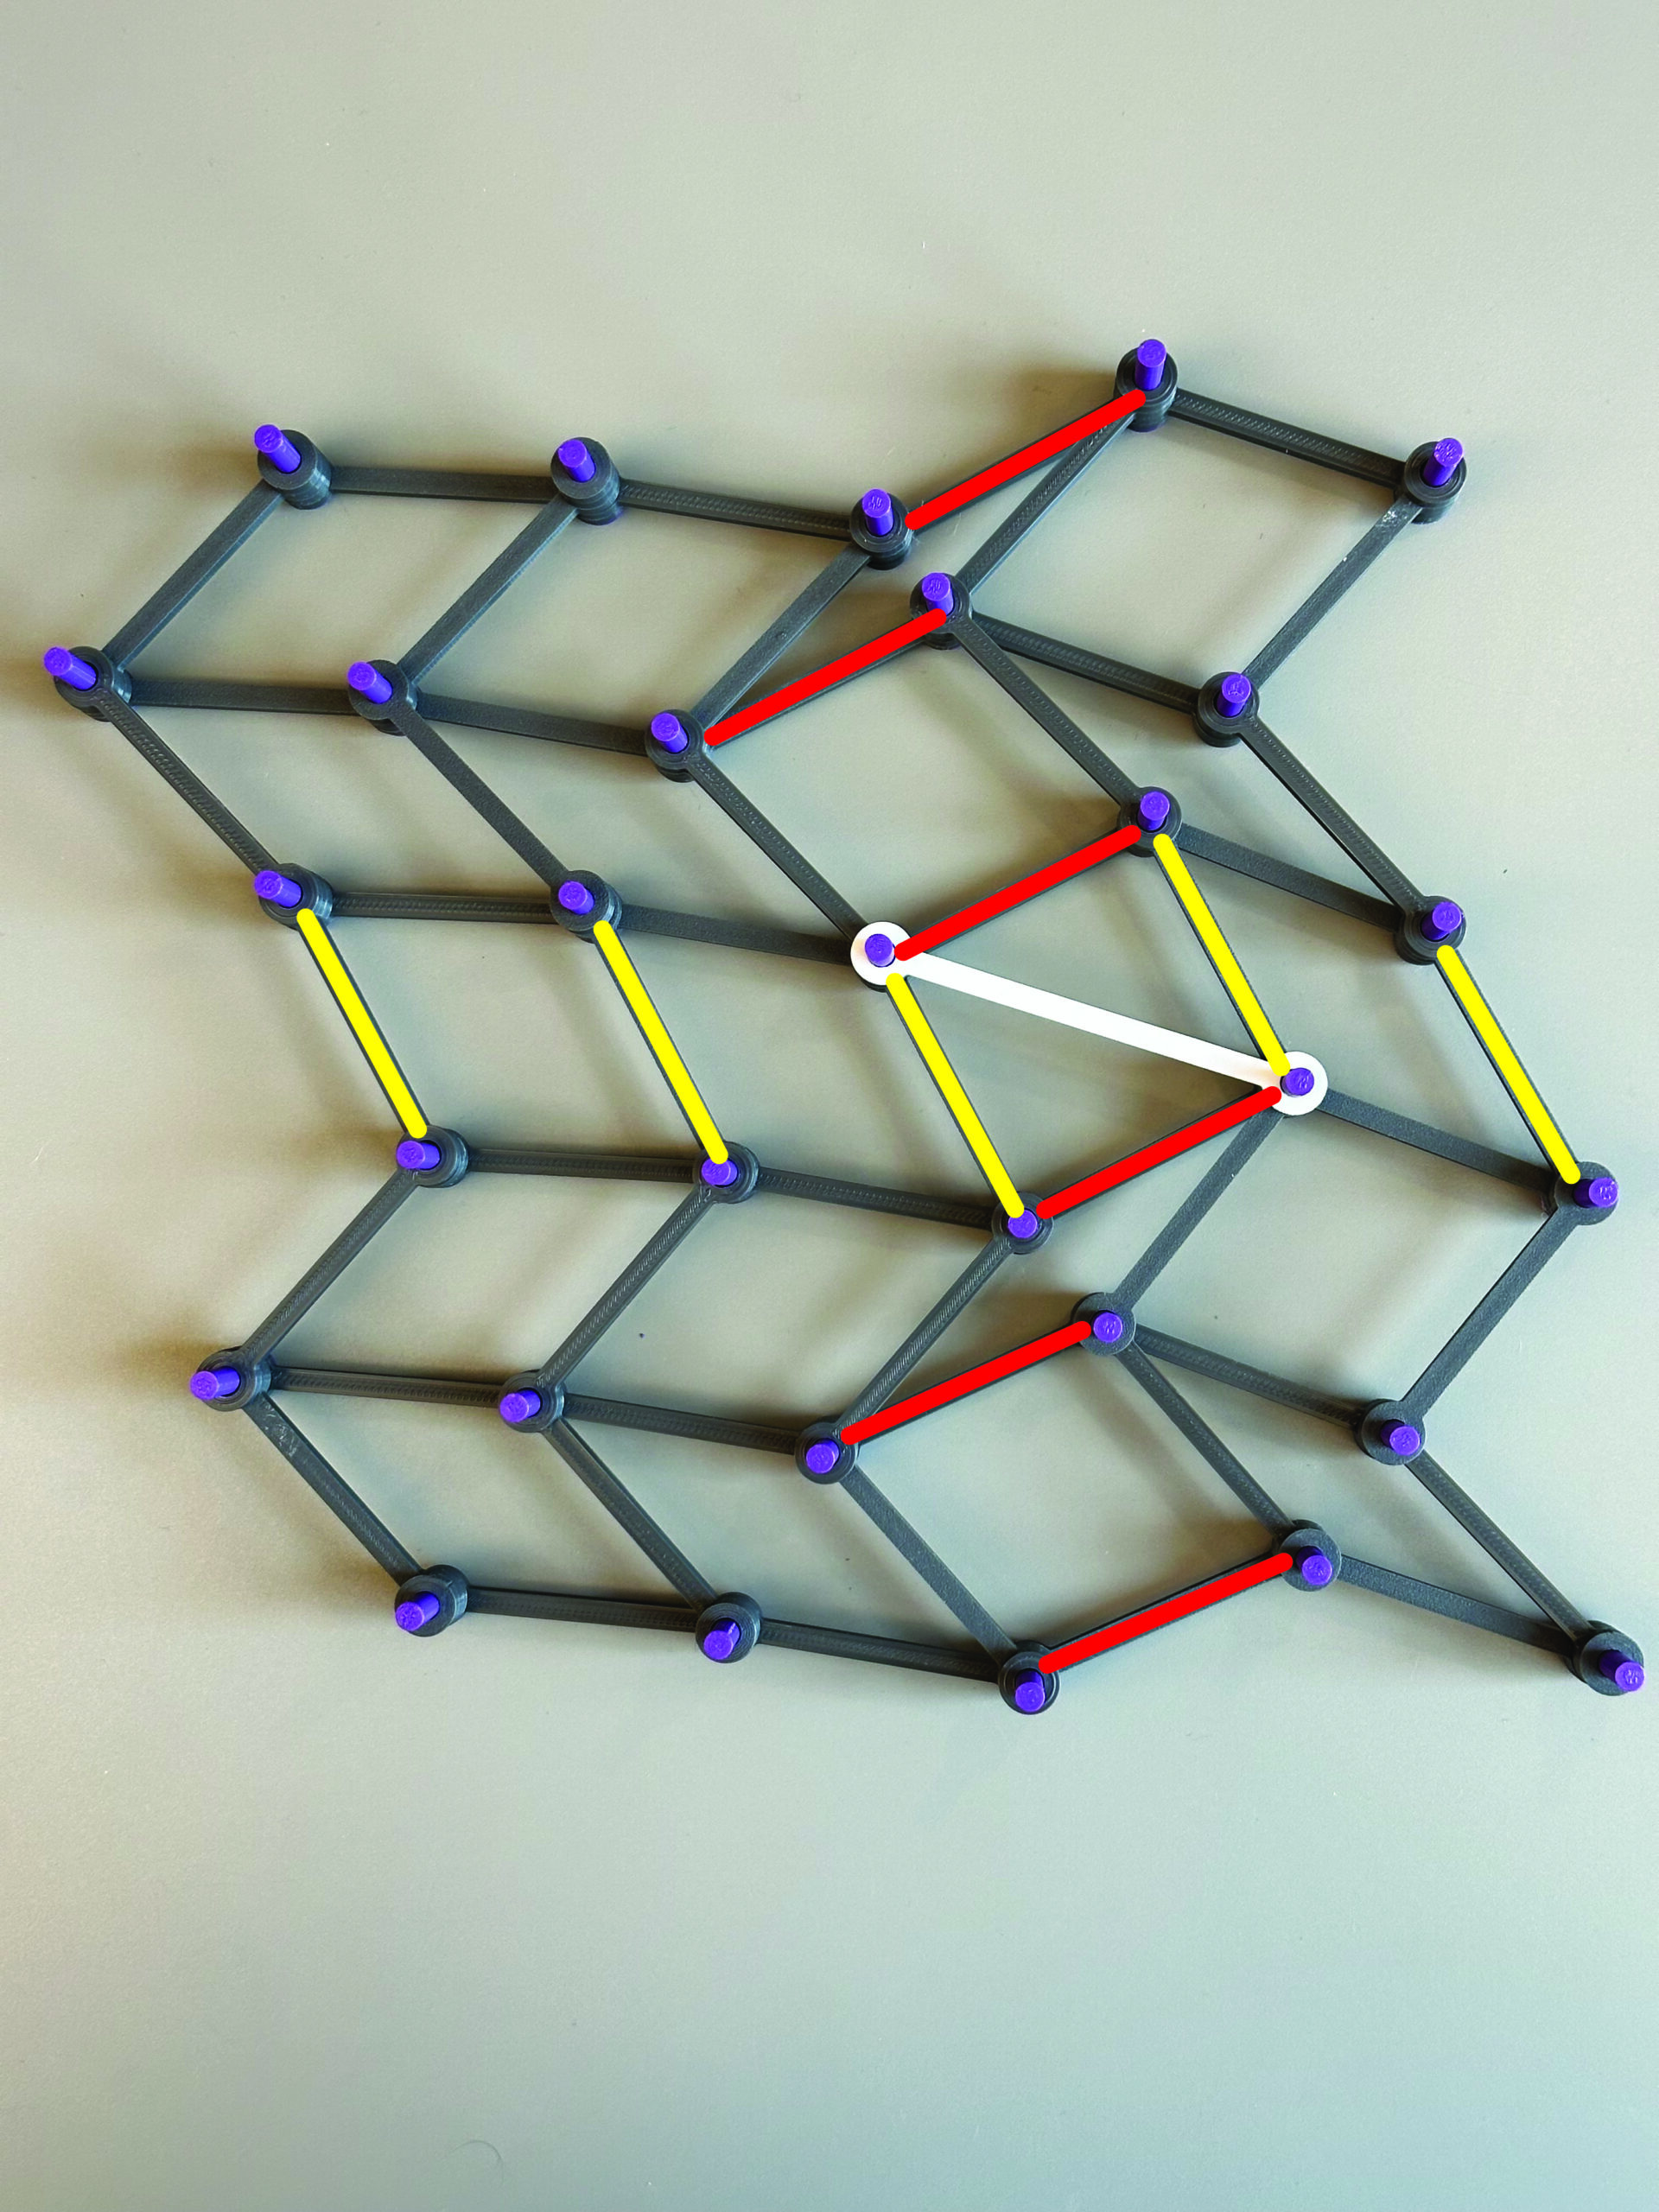
A crossbeam in a rhombus forces it to be square. If the square is in the ith row and jth column, then all the vertical bars in the ith row are perpendicular to all the horizontal bars in the jth column. The photo below shows how one white crossbeam forces the yellow bars to be perpendicular to the red bars.
To achieve a rigid bracing, we need the vertical bars in every row to be perpendicular to the horizontal bars in every column. Here is where the graph theory comes in.
First, we construct what is called a bipartite graph from any bracing structure. Create two collections of vertices, one representing the rows of squares and one representing the columns of squares. Draw an edge from the vertex for the ith row to the vertex for the jth column if there is a crossbeam in the ith row and jth column. The graphs for our two structures are shown below.
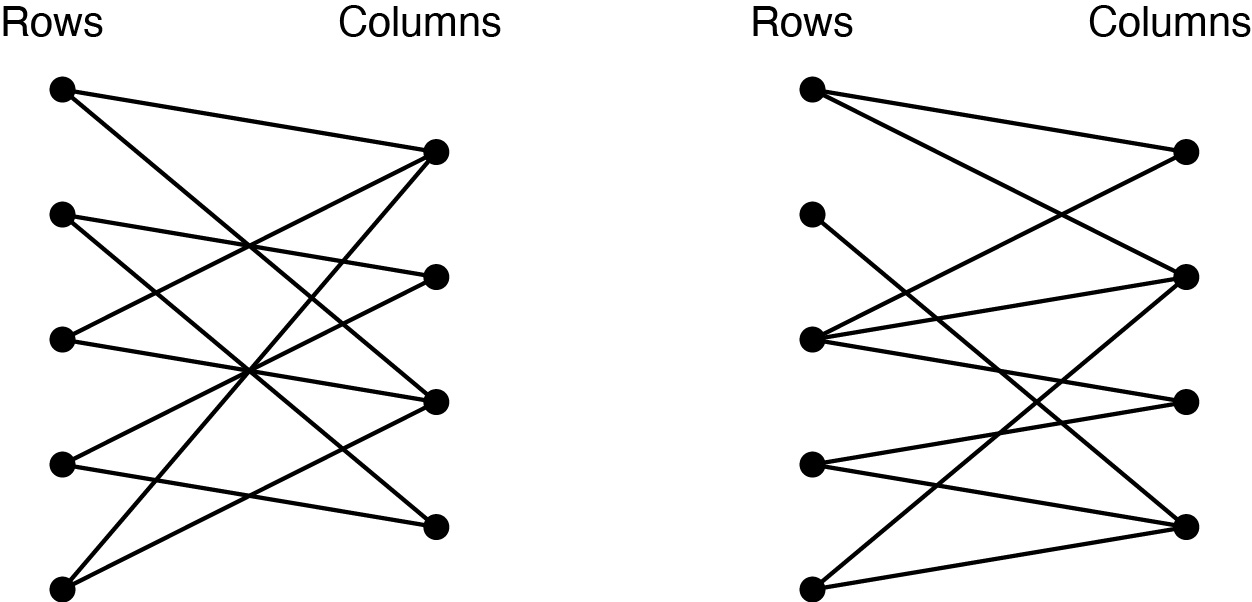
Because a bracing bar makes the horizontal bars in that column perpendicular to the vertical bars in that row, it follows that if there is a path in the graph from the ith row to the jth column, then, following the sequence of edges, we conclude that the vertical bars in the ith row are perpendicular to the horizontal bars in the jth column. So, a structure is rigid provided we can find a path in the graph from any vertex to any other vertex! In the language of graph theory, we obtain the following remarkable conclusion.
A braced structure is rigid if and only if the associated bipartite graph is connected.
Moreover, a graph theorist can tell you that the smallest connected graph for a given set of vertices is a tree—a connected graph with no cycles. A tree that’s also a bipartite graph with m + n vertices has m + n − 1 edges.
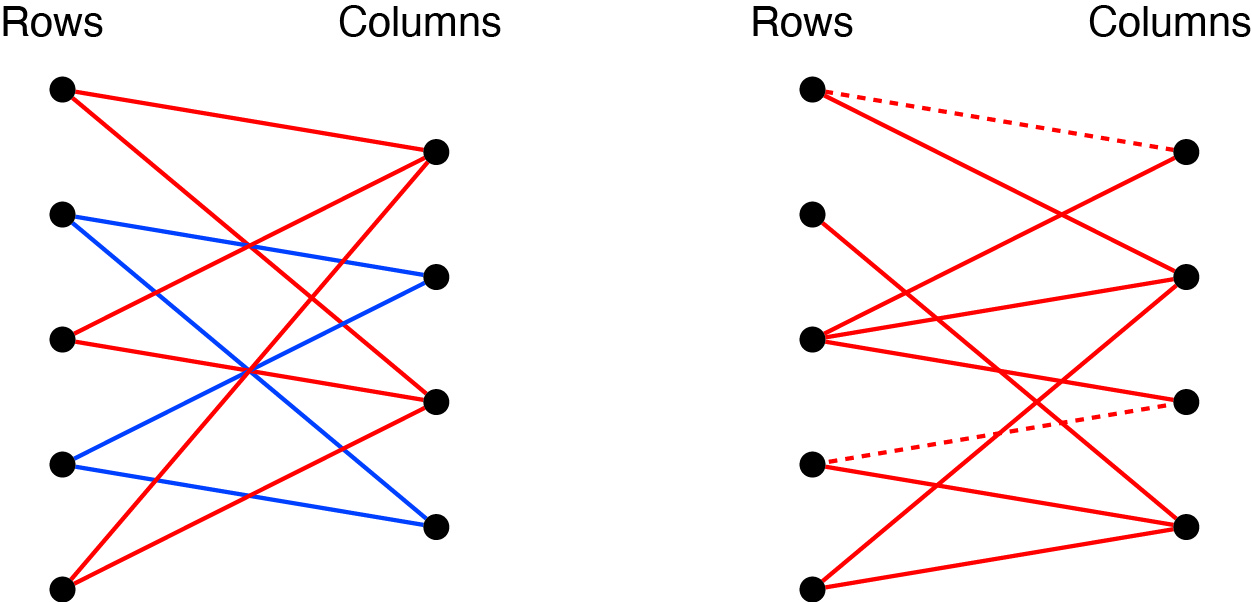
Returning again to our two initial examples, there are five rows and four columns, so we should be able to brace the structure with 5 + 4 − 1 = 8 crossbeams. The structure that is not rigid has 10 crossbeams, but, as we see below, the bipartite graph is not connected. On the other hand, the bipartite graph associated with the rigid structure is connected. Since it also has 10 crossbeams, we can remove two crossbeams (the two dashed edges) and still have a rigid structure.
Now, let’s consider a different question. What if the crossbeams are replaced by wires? The wires are not rigid (they can collapse) but cannot stretch. Now, how do we cross-brace the structure so it is rigid? Below, we see two structures, each with 10 tension bracing wires. Are either of them rigid?
We leave the full analysis to the interested reader, but we will give the punchline. It was irrelevant whether we oriented a rigid bracing bar northeast-southwest or northwest-southeast inside a square, but the orientation makes a crucial difference for a tension cable.
Again, draw a bipartite graph, but this time, the edges are directed–that is, they have arrowheads indicating a direction. If the tension bracing runs northeast-southwest, draw the arrow from the row vertex to the column vertex. If the bracing runs northwest-southeast, draw an arrow from the column vertex to the row vertex.
We can show that a structure with tension wires is rigid provided we can get from any vertex to any vertex by following the arrows. In graph theory terminology, we say the following.
A structure with tension bracings is rigid if and only if the associated directed graph is strongly connected.
Moreover, if the structure has m rows and n columns, we need m + n + 1 cables.
Below are the graphs for our two structures. They both have the necessary 5 + 4 + 1 = 10 cables. However, the first graph is strongly connected, but the second one is not.
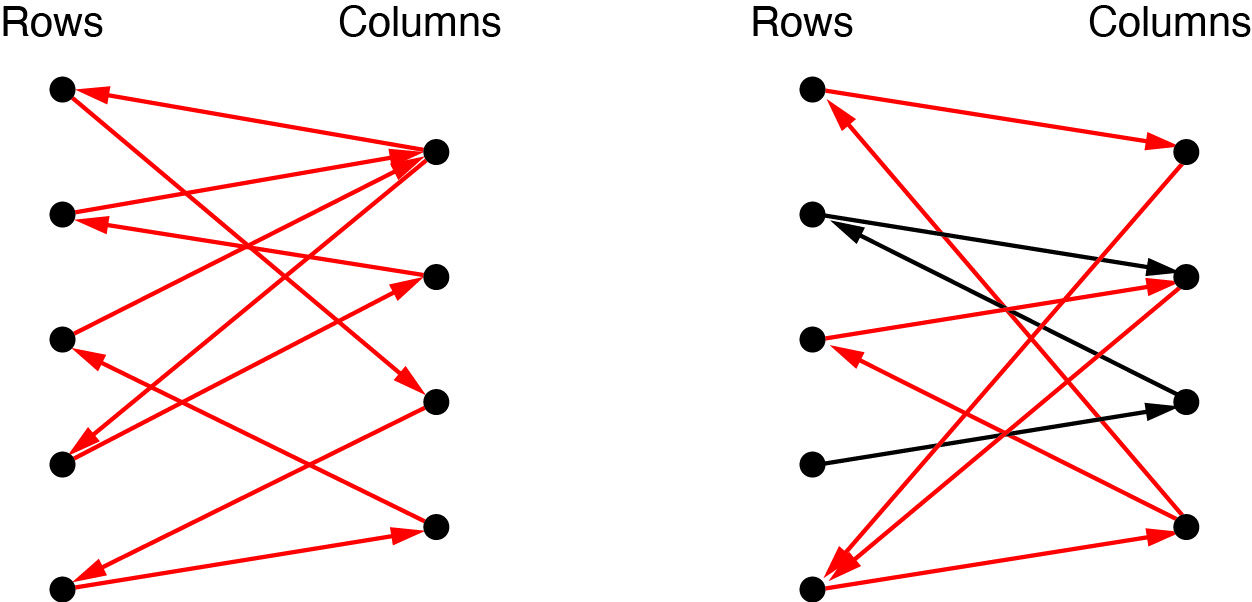
In the second graph, getting from columns 1 or 4 to rows 2 or 3 is impossible. Indeed, as we see below, the structure is not rigid.
To 3D-print your own rods and pins, download the STL files from Thingiverse. To read more about this topic, see, for instance, Sections 2.6 and 4.4 of Counting on Frameworks by Jack E. Graver.
 Dave Richeson is a professor of mathematics and the John J. & Ann Curley Faculty Chair in the Liberal Arts at Dickinson College in Carlisle, Pennsylvania, USA, and is the author of Euler’s Gem (Princeton University Press, 2008) and Tales of Impossibility (Princeton University Press, 2019). You can follow him on Mathstodon and X, or look at his homepage.
Kit Yates – When will we ever need to use maths?
“When will we ever need to use this?” It’s the question asked perennially in maths classrooms up and down the country and indeed around the world. But is it a fair one, and how should we answer it?
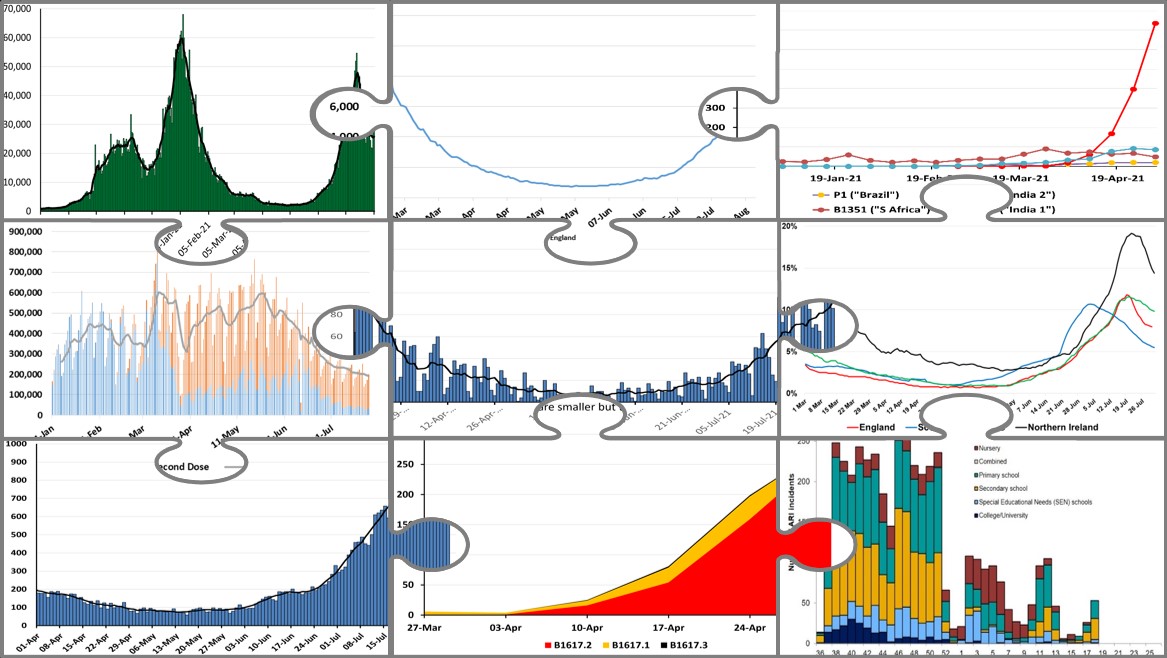
The pandemic has provided some very upfront answers. For the last few years we have been hearing regularly about the potential for cases to rise exponentially. News programmes carried regular features on the reproduction number, R. Others reported, in vain, that we might nearly have reached elusive mathematically defined herd immunity thresholds.
We relied on mathematical models, not only to understand the current situation, but to predict what might happen in the future, from the impact of mitigations to the effectiveness of vaccines. We used maths to determine the most efficient order to deliver jabs during the vaccine roll out and to plan the roadmap out of lockdown in early 2021. Maths was front and centre much of the time.
Even outside times of crisis we see maths in the newspaper headlines every day. We use it to establish whether our politicians are telling the truth about unemployment. Maths allows us to monitor exchange rates during currency crashes. It is invaluable to opinion pollsters determining the popularity of our political parties and to fact checkers holding politicians to account.
Away from the front-page headlines, maths is the language of science. It appears everywhere from physics to engineering and chemistry – aiding us in understanding the origins of the universe and building bridges that won’t collapse in the wind. Perhaps a little more surprisingly, maths is also increasingly integral to biology. Scientists in my own specialist area of mathematical biology, are helping to develop treatments for diseases and to answer the question of how the leopard got its spots.

Beyond the academy, we are increasingly employing maths in sport to enhance the performance of our top athletes and in the movies to create computer-generated images of scenes that couldn’t exist in reality. More mundanely we are frequently using maths in our everyday lives when we go shopping or when we are following a recipe, when we tell the time or when we budget for the future. Much of the time we do it without even realising it.
Certainly, much of the maths we learn early on in school we use directly in our everyday lives. Other topics that we might have learned later, or perhaps we never got round to, are essential for the functioning of modern society even if we don’t often see their use directly.
There are certainly bits of maths (particularly pure maths) for which is it harder to imagine a direct use. But isn’t this true of every subject? Should we hold geography, for example, to the same exacting standards of utility we expect of maths. I don’t remember the last time I put my hard-won knowledge of ox-bow lakes to use. Similarly, in chemistry, when was the last time you needed to write down the chemical reaction diagram depicting esterification? Probably not recently.
This is not to denigrate these subjects, but to point out that this is not a maths specific issue. Perhaps maths suffers more because it is harder to visualise the direct application of an algebraic equation than it is to picture the flow of water in a river, for example. We can all remember sitting by a river watching the water flow past, but fewer of us, I would suggest, can imagine laying down our picnic blanket on the complex plane of an Argand diagram.
By necessity maths tends to deal in generalities and therefore abstractions from reality. But, at least in part, it is the generality – the abstractness – which makes mathematics so pervasive.
At university I teach students that a single abstract equation can describe the spread of heat through your radiator, the diffusion of a drop of food colouring in a glass of water and the random dispersion of cells on a petri dish. With such a diverse range of applications you can start to see how powerful it is to study a seemingly abstract and lifeless equation for the deep insights it can provide about these ostensibly unrelated systems.
It was not for nothing that Philosopher Eugene Wigner wrote of “The unreasonable effectiveness of mathematics” for describing the natural world. Many simple mathematical ideas come up over and over again in different areas. The normal distribution – or bell curve – for example can be used to describe people’s IQs as well as their heights and, by a strange quirk of fate, the density of that diffusing drop of food colouring in the glass I described above amongst hundreds of other applications.

The equation 2+2=4 describes what happens when you have two apples and your friend gives you two more. But this isn’t an equation about apples, it’s about bananas or oranges or grapes or absolutely anything, in fact, that comes in discrete packages. So general is the equation that it would be odd to narrow its applicability by forcing it into a specific real-world context.
It may be that the problem mathematics faces is that there are too many applications. Perhaps we should be responding to the question “When will we ever need to use this?” with the counter “When will you not?”
 Kit Yates is an author, communicator and academic mathematical biologist who is interested in sharing stories about the places where maths can impact our lives without us even realising it. You can follow him on Mastodon and X, or look at his homepage.
So, which bit of maths has tickled your fancy the most? Vote now!
Match 8: Dave Richeson vs Kit Yates
- Dave with rigid graphs
- (63%, 175 Votes)
- Kit with uses for maths
- (37%, 101 Votes)
Total Voters: 276
This poll is closed.
The poll closes at 08:00 BST tomorrow. Whoever wins the most votes will get the chance to tell us about more fun maths in the quarter-final.
We’ve got a day off before the next round of the competition. Come back on the 10th for the first quarter-final match, pitting Competitor 3 against Competitor 4, or check out the announcement post for your follow-along wall chart!
Simplicity is the voice of reason!
It was very difficult for me to choose on this one. It’s almost unfair that one is very specific and insightful, and the other is very broad and general. Both make me think! I wish they could both go through!
I found Dave’s post so interesting! It was the perfect balance of concrete and abstract for me. A new use for graphs that I have never considered!
Both entries were so great – but I want to use Dave’s idea next time I give a workshop (I had seen the proof before, but the physical demonstration brings it to the next level)!