There are many ways to estimate or calculate π, that number that is irrational, but well-rounded. But perhaps none is as remarkable as that outlined in a 2013 paper by G. Galperin. In this brief article we’ll have a look at the problem, and see the setting, although we’ll leave the interested reader to hunt down the details.
So think of a setting where we have two balls of the type only found in physics problem. Sufficiently smooth that they slide, not roll, and perfectly elastic do that when they collide both momentum and energy are precisely preserved.
Clearly we want to bang these things together and see what happens. In an unconstrained setting they collide, depart, and that’s the end of it, but let’s do two things. Firstly, again as in all good physics problems, we’ll constrain them to move in one dimension. Secondly, we’ll put in their way a perfectly elastic barrier of infinite mass.
So picture the situation. We have a wall on the left, a harmless, defenseless ball sitting, minding its own business, and another ball comes careering in from the right and collides with it. The first ball is astonished, and runs away to the left, where it bangs into the wall and rebounds, returning to its unexpected assailant. There it has another collision.
If the two balls are of equal size, that’s where the story ends. There have been three collisions in total, and now the original ball is back where it started, shaken but not stirred (because it slides, not rolls) and the assailant is returning whence it came.
Equal masses, three collisions.
We can now explore how many collisions we have when the ball coming in from the right is not of equal mass. To make things easy we’ll call the initially stationary ball $X$, and the incoming assailant ball $Y$. We can assume ball $X$ has a mass of 1 kg, so we only need to think about the mass of ball $Y$.
Here’s a table:
| Mass of $Y$ | Number of Bounces |
|---|---|
| 1 | 3 |
| 2 | 5 |
| 3 | 5 |
| 4 | 6 |
| 5 | 7 |
| 6 | 8 |
| 7 | 8 |
| 8 | 9 |
| 9 | 9 |
| 10 | 10 |
Well, that doesn’t seem very interesting really. Let’s try a few more values – bigger values:
| Mass of $Y$ | Number of Bounces |
|---|---|
| 10 | 10 |
| 20 | 14 |
| 30 | 17 |
| 40 | 20 |
| 50 | 22 |
| 60 | 24 |
| 70 | 26 |
| 80 | 28 |
| 90 | 29 |
| 100 | 31 |
If we plot these we find that the number of bounces seems to be growing as the square root of $M$, the relative mass. That’s interesting, so we change the values and try again:
| $N$ | Mass ($N^2$) | Number of bounces |
|---|---|---|
| 1 | 1 | 3 |
| 2 | 4 | 6 |
| 3 | 9 | 9 |
| 4 | 16 | 12 |
| 5 | 25 | 15 |
| 6 | 36 | 19 |
| 7 | 49 | 22 |
| 8 | 64 | 25 |
| 9 | 81 | 28 |
| 10 | 100 | 31 |
| … | … | … |
| 100 | 10000 | 314 |
| … | … | … |
| 110 | 12100 | 345 |
| 111 | 12321 | 348 |
| 112 | 12544 | 351 |
| 113 | 12769 | 355 |
| 114 | 12996 | 358 |
| … | … | … |
To the experienced eye, two things immediately jump out at you. Firstly, we have these values:
\begin{array}{rrr}
1 & 1 & 3 \\
10 & 100 & 31 \\
100 & 10000 & 314
\end{array}
But even more interestingly, we get this line:
\begin{array}{rrr} 113 & … & 355 \end{array}
Recognise this? Here we have one of the most accurate estimates for π, $355/113 \approx 3.14159292…$
It would seem that:
\[ \text{Number of bounces} \approx \pi \times \sqrt{M} \]
How is this happening?!? It would seem that there is no circle, so it would be a mystery as to how π can emerge.
But in fact there is a circle, it’s just that it’s folded up, fan-like, in phase space.
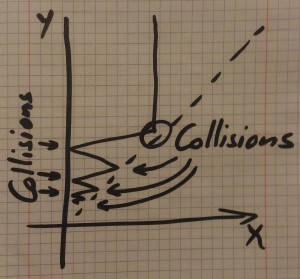
A complete explanation is beyond this article, but the idea is this. We let $x$ be the position of the smaller, initially stationary ball, (which we call ball $X$) and let $y$ be the position of ball $Y$. For any given moment we can plot a point $(x,y)$ showing their position. Since the larger ball is always on the right, $y$ is always larger than $x$, so we only need to use the area of the plane in the top right quadrant, and above (or on) the line $y=x$.
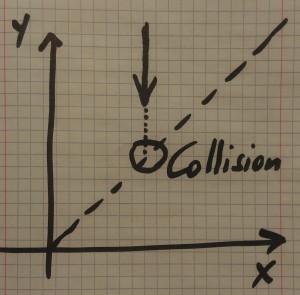
Diagram 1
Diagram 1 shows the approach of the larger ball from the right. The value of $y$ is decreasing, $x$ remains constant, and then they collide when $x=y$.
After they collide the value of $x$ will be decreasing, and depending on the relative masses, $y$ can be decreasing, zero, or increasing. This is shown in Diagram 2.
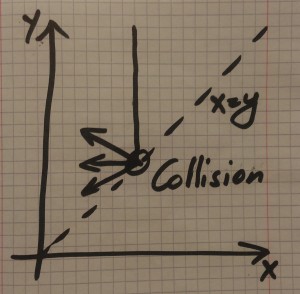
Diagram 2
When ball $X$ hits the wall it bounces off and heads back to the right. Again, depending on the original masses the balls may or may not meet again. However, if the mass ball $Y$ (coordinate $y$) is larger, then the balls meet, bounce, and on it goes. If ball $Y$ is sufficiently large we get something like Diagram 3.
Diagram 3
Now the magic happens. We can transform the diagram to make all the angles the same by stretching it out appropriately. When we do that the angle changes from 45 degrees to something else, call it $\alpha$. We show that in Diagram 4. Now we can “unfold” the wedge to become a fan, as per Diagram 5, and the zigzag path now becomes a straight line.
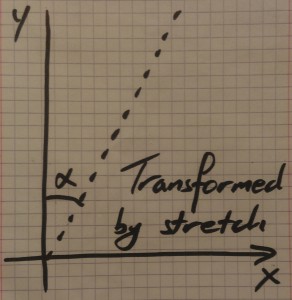
Diagram 4
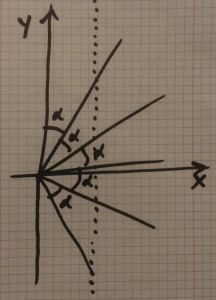
Diagram 5
Each collision in the original problem is now an intersection between the path and one of the fan lines, and there are $\pi/\alpha$ fan lines. That means there are $\pi/\alpha$ collisions, the result depending on the now mysterious value of $\alpha$.
But $\alpha$ can be calculated based on the mysterious transformation we applied earlier, and that turns out to be perfect just when it’s a stretch vertically by $\sqrt{M}$, and so all the pieces start falling into place. We get the $\sqrt{M}$ from the requirement that the transformation makes all the “bounce” angles equal, and we get the value π from the unfolding of the phase space diagram.
All very abstract, and lots of details to unpick and take time over. The details are in the paper, and the intention of this article was not to present all the gory details, but instead, to show that π can turn up in unexpected places, and to give enough of an outline to show why it happens in this case.
The original idea – count the collisions – seems so straight-forward, the result so unexpected, and the analysis, once understood, elegant.
An excellent example of the power of the abstract.
Afterword
When I first was shown this result it was just mind-blowing, and so unexpected and amazing. Then I saw a Numberphile video, but it wasn’t the same question that I remembered. The video talked about how many bounces before the larger ball changed direction, not the total number of bounces, and it had a strange extra factor of 16 floating around in the calculations. It was right, but it was a different question. I doubted my memory – had I got it wrong?
So I went and found the original paper and discovered that my memory was not faulty, and the original question did talk about the total number of bounces, and did not have the extra factor of 16. The method of solution seems totally different as well, but I’m starting to wonder if they are connected at some deeper level as yet undiscovered.
Most curious – still more to investigate.
Read the paper: Playing Pool With π (The Number π From A Billiard Point Of View) by G. Galperin.