This is the ninth match in our group stage: from Group 1, it’s Lucy Rycroft-Smith up against Grant Sanderson. The pitches are below, and at the end of this post there’s a poll where you can vote for your favourite bit of maths.
Take a look at both pitches, vote for the bit of maths that made you do the loudest “Aha!”, and if you know any more cool facts about either of the topics presented here, please write a comment below!
Lucy Rycroft-Smith – Object graphs

Lucy Rycroft-Smith is a researcher and writer at Cambridge Maths (an organisation creating an innovative map of school mathematics 3-19). She was a maths teacher for ten years across primary, secondary and HE and is the co-editor of Flip the System UK: A Teachers’ Manifesto. She’s @honeypisquared on Twitter.
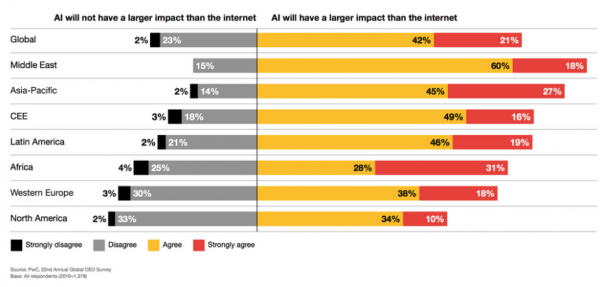
I love a good graph. I also love criticising terrible graphs, of which there are plenty to be hunted roaming wild on the internet. Like this, for example, titled ‘This is what the world’s CEOs really think of AI’ which gets worse the longer you look at it:
Lately, I have been having some serious fun with something called object graphs (not be confused with the programming thingies by the same name) which, as the nominal suggests, are graphs made out of the objects themselves as data pieces. The word ‘piece’ seems relevant here too, as reminiscent of art, and design, and museums (musea? Oh wait..maybe not). This is a cool area of maths that tips over into curation, collection and combination. Speaking of ‘nominal’ too, object graphs are a great way to think about what kind of data we have in front of us – or, in practice, can make out of what’s in front of us.

Some things, like a bookcase, can be considered as a found object graph– useful in everyday life to see how many things you have, whether you need to get more things, or compare numbers of things (pictured: 122 unordered books and one cat). You can extend the principle by taking a big messy set of stuff like Lego:

..and then sorting the bits into neat categories, piling them up in some kind of order, to make a sorted object graph like this, which is pretty satisfying. The end result is quite reminiscent of a skyline:
Actually, the word ‘order’ here is a bit of a sore point, as technically this is categorical data – a count of stuff labelled in categories, not by numbers – and so it shouldn’t really have an order. Graphing is full of people telling you what you can and can’t do with different types of data. (I spent many years teaching maths being secretly terrified of histograms. I suspect this kind of histogramophobia – or maybe histeria? – is reasonably common). I now fly in the face of this blatant black-and-white-ism – I think graphs are about playing with what you can do, rather than worrying about what you can’t. If it tells you something interesting about the data – and isn’t made to deceive anyone – it’s ok with me. The types of data we might actually want to use in the real world are almost always ‘fuzzy’ categories, rather than ‘crisp’ ones.
For example, colour is really interesting as a concept, because it can actually be seen as numerical, of course – if you’re a physicist, or a graphic designer, you are most likely very used to the idea of colour-as-data, on a light spectrum or as an RGB or CMYK code. Even in my Lego graph, you can see the categories are not really distinct, as some of the bricks have faded with time or are slightly different versions of the same colour. Like I said, lovely fuzzy boundaries. Yum.
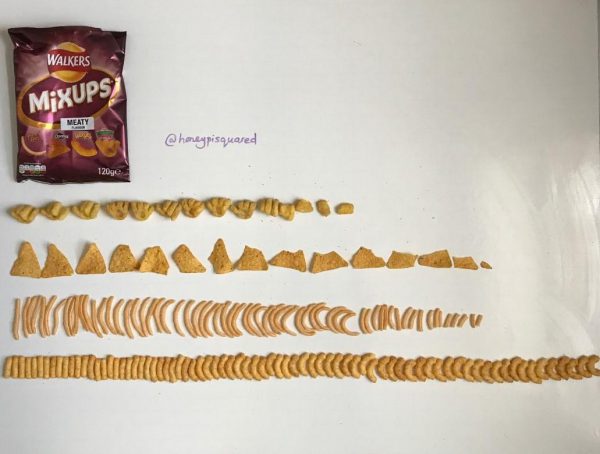
Speaking of crisp:
So why do it? Well, there’s some evidence that for those just learning to grapple with data, object graphs are a great way to begin to make the very complicated conceptual leap between ‘things in the world’ and ‘data’. It’s a big step for learners of maths to start to abstract properties and attributes of stuff, and goes beyond just statistical thinking for that reason.
Then there’s the really cool transition between counting things (numerosity) and measuring them (magnitude), which can be represented in graphing by the step from drawing counted things in organised rows to squishing the rows all together and making a measurable frequency axis, losing the individual ‘bits’ of data but gaining an ability to compare lengths instead of counts. It’s one of the key moments in moving from dealing with ideas of discrete data towards more continuous data, and thus particularly exciting, I think. You can see with the Lego that actually it’s hard to see the boundaries between individual bricks at scale, and so the data has in some sense been continuised in the y-direction, forming a graph just as much about the area (or indeed volume, in 3D) of Lego bricks I have in each colour. Object graphs are about seeing things-as-data in the most simple and sometimes the most appealing ways. I also happen to find them really, really fun.
Another fascinating direction you can take object graphs in is to encode some other information too, and make them an art/biology/maths/whatever else you like hybrid, giving you data about frequency as well as other properties like size and shape for recognition or classification purposes. Here is a rather beautiful hedgerow sample object graph (all plants were culled from my property and no trespassing of any kind was undertaken in the making of this graph).

Finally, let’s add one more ingredient: a lovely pun. I’ve been waiting for years to do this; enjoy my bra graph (collapses into laughter).

Grant Sanderson – Understanding e to the i pi in 3.14 minutes

Grant Sanderson makes videos on the YouTube channel 3blue1brown centered on visualizing math. Once upon a time, he also used to make content for Khan Academy. He’s @3blue1brown on Twitter.
Who doesn’t love Euler’s formula, $e^{i \pi} = -1$? It might just be the most famous formula in math, perhaps due in small part to how wonderfully absurd, even nonsensical, it seems when you first hear it. Of course, as a math student, you gradually come to realize that the function $f(t) = e^t$ is something more than repeating multiplication by some special constant around 2.71828; its natural home and birthplace is calculus, where it stands proud as a function which is its own derivative. This I-am-my-own-rate-of-change property actually lends itself to a wonderful intuition for why Euler’s formula should be true. Not in terms of manipulating Taylor series, as is often done in a calculus class, but with a more dynamic illustration which is, for whatever reason, not taught that often.
This video animates that approach, and how if you’re comfortable with $e^t$ being its own derivative, and with the idea that multiplying a complex number by $i$ rotates it 90 degrees, the relationship between $e^{it}$ and circles becomes almost obvious.
So, which bit of maths do you want to win? Vote now!
Match 9: Group 1 - Lucy Rycroft-Smith vs Grant Sanderson
- Lucy with object graphs
- (56%, 579 Votes)
- Grant with pi and e and all that
- (44%, 463 Votes)
Total Voters: 1,042
This poll is closed.
The poll closes at 9am BST on the 10th. Whoever wins the most votes will win the match, and once the group stages are over, the number of wins will determine who goes through to the semi-final.
Come back tomorrow for our tenth match of the group stages, featuring Vincent Pantaloni and Jorge Nuno Silva. Or check out the announcement post for your follow-along wall chart!
One Response to “The Big Internet Math-Off 2019, Group 1 – Lucy Rycroft-Smith vs Grant Sanderson”