This is the eighteenth match in our group stage: from Group 2, it’s Marianne Freiberger and Rachel Thomas up against Sameer Shah. The pitches are below, and at the end of this post there’s a poll where you can vote for your favourite bit of maths.
Take a look at both pitches, vote for the bit of maths that made you do the loudest “Aha!”, and if you know any more cool facts about either of the topics presented here, please write a comment below!
Marianne and Rachel – Fourier transforms of images

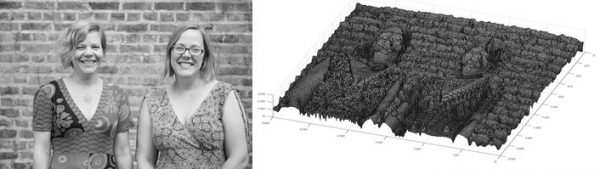
Marianne and Rachel are co-editors of Plus magazine, a free online magazine about maths aimed at a general audience. They have also written three popular maths books and edited one.
The sounds we hear – whether music, speech, or background noise – are the result of vibrations of our ear drum, stimulated by sound waves travelling through the air, created by our headphones, musical instruments, people’s voice boxes, or that annoying person behind you in the cinema opening their sweets. These vibrations can be plotted (the intensity, or pressure, of the wave plotted over time) giving us a visual representation of the sound.
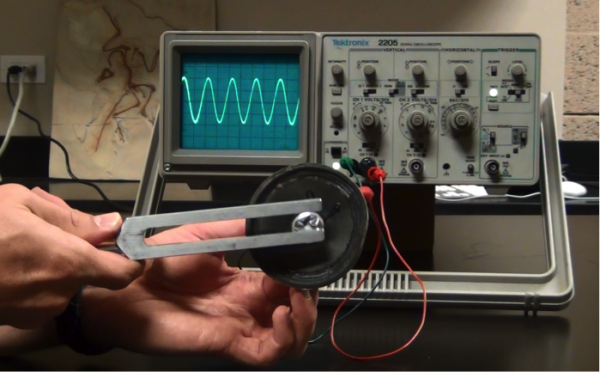
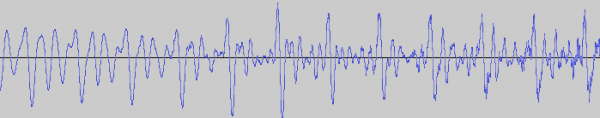
The sound wave of the middle A on a tuning fork, is a perfect example of a sine wave, written mathematically as $\sin(x)$. The sound wave of speech is more complicated. But any sound wave, indeed any repeating function, can be broken up into a number of sine waves of various frequencies and amplitudes (intensities). This is the result of work that started with the French mathematician, Joseph Fourier, who lived through the French revolution in the eighteenth century. The expression of a sound wave, or any signal varying over time, as the sum of its constituent sine waves, is known as the Fourier transform of that signal. (You can read a more detailed explanation of the maths involved here – the maths is quite complicated but the mathematical ideas involved are lovely!)
You can also think of an image as a varying function, however, rather than varying in time it varies across the two-dimensional space of the image. In a grey scale digital image the pixels each have a value between 0 and 255 representing the darkness of that pixel. So the darkness, or intensity, of that pixel, is a function of the horizontal and vertical coordinates giving the location of that pixel. You can think of the image as an undulating landscape, with the height of the landscape given by the value of the pixel.
Images can also be expressed as a sum of sine waves, but this time, instead of one-dimensional waves, they are waves that vary in two-dimensions, like ripples on a sheet.
Two-dimensional sine waves are written as
\[ z = a \sin(hx + ky) \]
where $x$ and $y$ give the coordinates for points on the “sheet”, $z$ is the height, or intensity, of the wave at that point, a gives the amplitude (the maximum height) of the wave, and $h$ and $k$ give the number of times the wave repeats in the $x$ and $y$ directions respectively (they are the $x$ and $y$ frequencies).
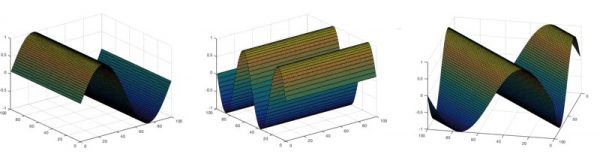
When $k=0$, the sine wave only fluctuates along the $x$-axis. When $h=0$, it only fluctuates along the $y$-axis. But if both $k$ and $h$ are nonzero, the sine wave moves diagonally across the sheet, with the waves travelling in direction (perpendicular to wave fronts) angled with the slope $h/k$.
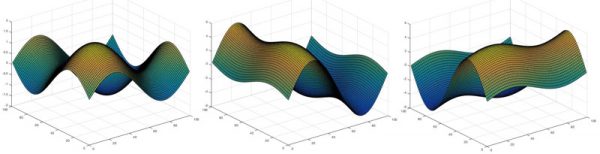
Adding these waves together just involves adding the respective values, or heights, of the waves at each pixel. The waves can constuctively interfere creating a final wave with a higher value at that point. And the waves can destructively interfere and cancel out. If the amplitude of one of the constituent waves is much larger than the others, it will dominate.
The Fourier transform of an image breaks down the image function (the undulating landscape) into a sum of constituent sine waves. Just as for a sound wave, the Fourier transform is plotted against frequency. But unlike that situation, the frequency space has two dimensions, for the frequencies $h$ and $k$ of the waves in the $x$ and $y$ dimensions. So it is plotted not as a series of spikes, but as an image with (roughly) the same dimensions in pixels as the original image.
Each pixel in the Fourier transform has a coordinate $(h,k)$ representing the contribution of the sine wave with $x$-frequency $h$, and $y$-frequency $k$ in the Fourier transform. The centre point represents the $(0,0)$ wave – a flat plane with no ripples – and its intensity (its brightness in colour in the grey scale) is the average value of the pixels in the image. The points to the left and right of the centre, represent the sine waves that vary along the $x$-axis, (ie $k=0$). The brightness of these points represent the intensity of the sine wave with that frequency in the Fourier transform (the intensity is the amplitude of the sine wave, squared). Those vertically above and below the centre point represent those sine waves that vary in $y$, but remain constant in $x$ (i.e. $h=0$). And the other points in the Fourier transform represent the contributions of the diagonal waves.
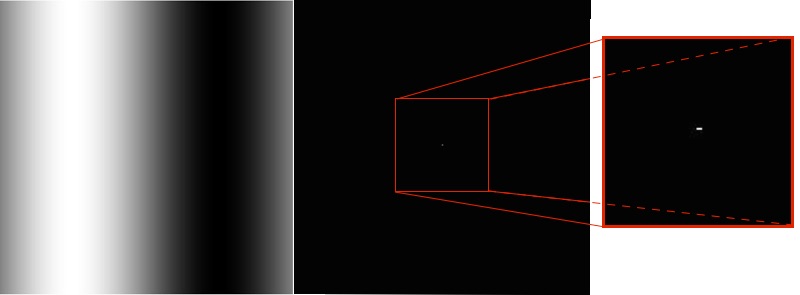
For example, consider the image above, on the left. This is the two-dimensional wave $\sin(x)$ (which we saw earlier) viewed as a grayscale image. Next to it is the Fourier transform of this grayscale image. It has the same dimensions in pixels as the original, and is entirely black except for a few bright pixels at the very centre. If we zoom into the centre of the Fourier transform (which you can see above, on the right) you can see there are exactly three pixels which are not black. One is the bright centre point, with coordinates $(0,0)$, representing the contribution of the $(0,0)$ wave to the image. The bright pixel on either side, with coordinates $(1,0)$ and its reflection $(-1,0)$, represents the contribution of the $(1,0)$ wave (the sine wave in our original image). All the rest of the pixels in the Fourier transform are black, as the original image is exactly described using just the original $(1,0)$ wave.
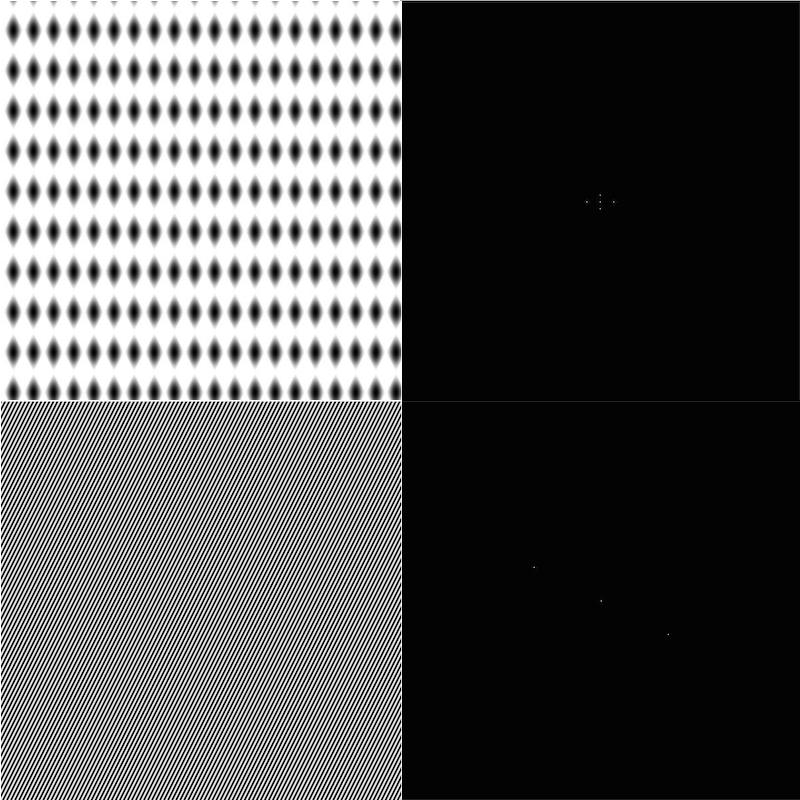
Bottom: The wave $\sin(100x+50y)$ and its Fourier transform, showing just the pair of bright pixels at the coordinates $(100,50)$ and its reflection.
The Fourier transforms of simple combinations of waves have only a few bright spots. But for more complex images, such as digital photos, there are many many bright spots in its Fourier transform, as it takes many waves to express the image.
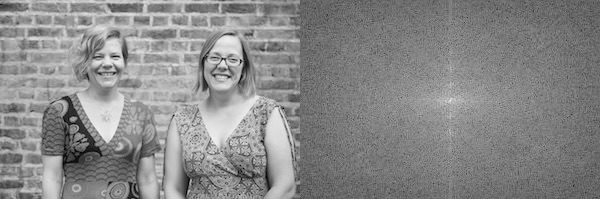
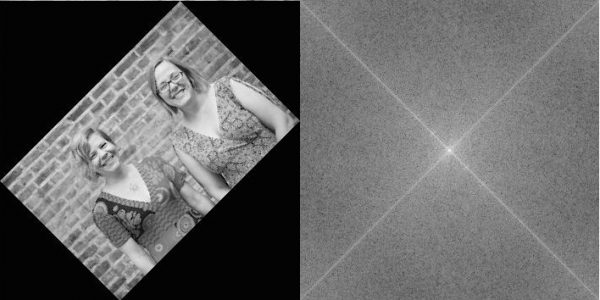
In the Fourier transform of many digital photos we’d normally take, there is often a strong intensity along the $x$ and $y$ axis of the Fourier transform, showing that the sine waves that only vary along these axes play a big part in the final image. This is because there are many horizontal or vertical features and symmetries in the world around us – walls, table tops, even bodies are symmetrical around the vertical axes. You can see this by rotating an image a little (say by 45%). Then its Fourier transform will have a strong intensity along a pair of perpendicular lines that are rotated by the same amount.
Fourier transforms are incredibly useful tools for the analysis and manipulation of sounds and images. In particular for images, it’s the mathematical machinery behind image compression (such as the JPEG format), filtering images and reducing blurring and noise.
The images of 2D sine waves, surfaces and Fourier transforms were made in MATLAB – in case you’d like to try it yourself you can see the commands we used.
Sameer Shah – Geometric Surprises!

Sameer Shah has been teaching high school math in Brooklyn for the past twelve years. You can read his musings about his classroom at Continuous Everywhere but Differentiable Nowhere. He’s @samjshah2 on Twitter.
My big theme in this competition is the unexpected. I am hoping to get across the feeling of awe that I get when I see something that seems ridiculous but is actually true. Like a few years ago, I was going down the internet rabbit hole and learned that if you draw the angle trisectors into any triangle, something special will pop up. I mean, I had many years of recreational math under my belt, and know lots of theorems involving triangles, and I had never seen this before. My brain exploded:
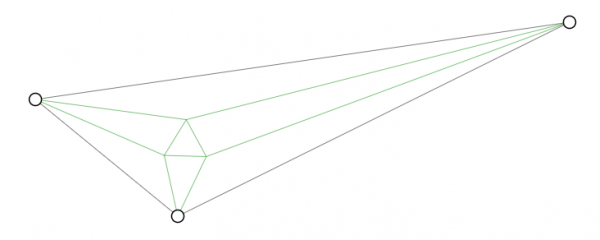
Every triangle has hidden within it an equilateral triangle. Do you see it above? Play around with this applet to see! And you can click on the links at the bottom of the page to learn more. It also shocked me to learn that this seemingly simple fact about all triangles was only discovered in 1899. (And we all know triangles have been around way longer than that. *grin*)
But that’s not today’s pitch. Today’s pitch involves a circle. The most symmetrical of mathematical creatures. It holds many secrets, like hiding in every circle is the irrational number π. Today I hope to surprise you with something I only learned a few years ago.
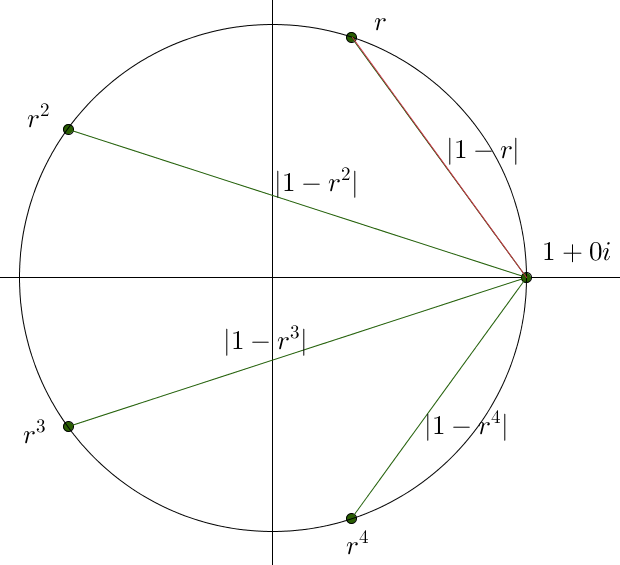
Take the most humble of all circles, a circle with radius 1. Draw 5 points equidistant around the circumference. Now pick any one of the points and connect it to the other four.
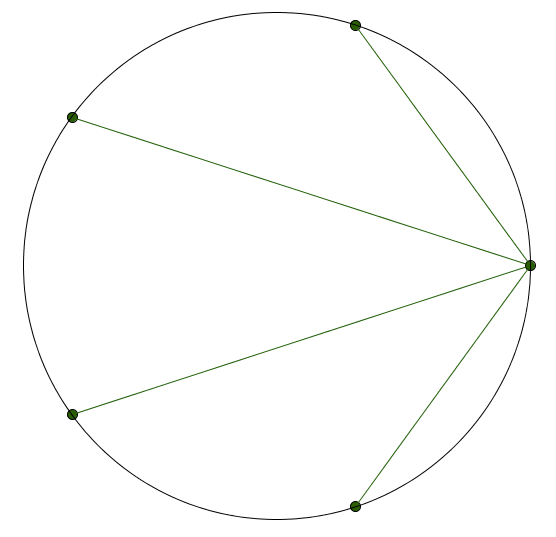
There’s a lot to notice about this empty diagram, but I’m going to focus your attention a bit. I’m going to include the approximate lengths of these segments.
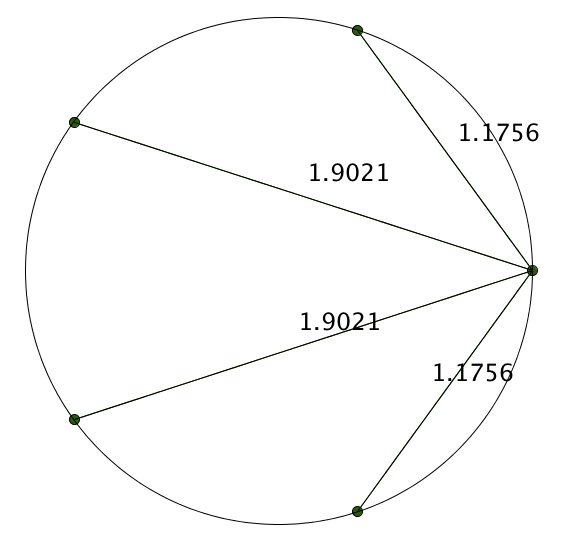
Things still don’t look all that interesting. But as a mathematician, sometimes you throw stuff against the wall in order to make order out of chaos. And occasionally, it works! Here’s us throwing stuff against a wall: multiply them all.
\[ (1.1756)(1.9021)(1.9021)(1.1756) \approx 5.0002 \]
That’s suspiciously close to 5. Hmmm. Let’s look at some more.
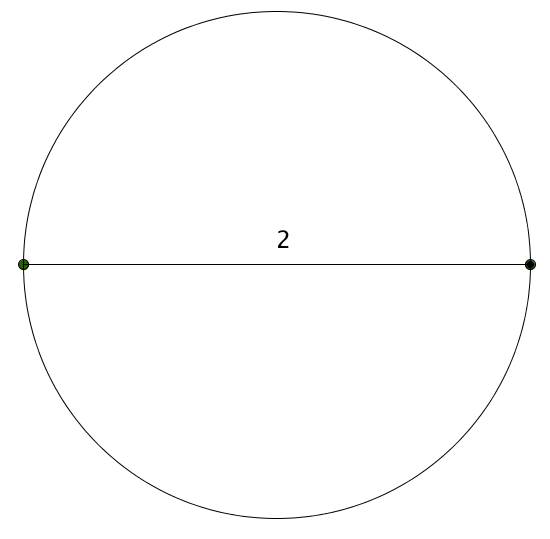
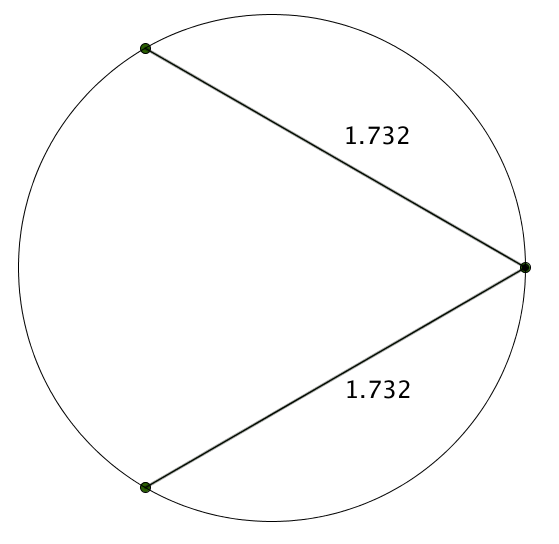
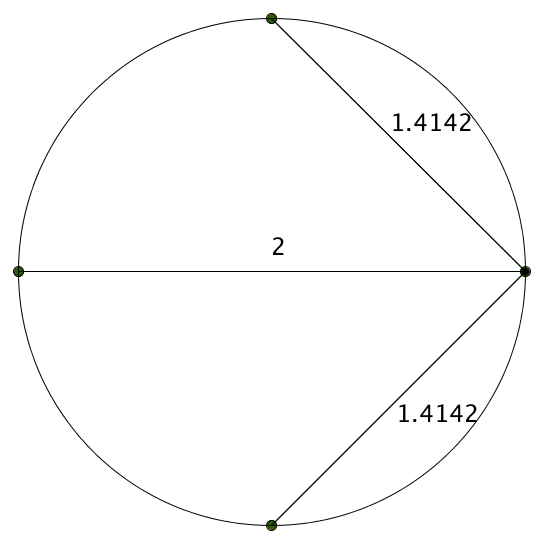
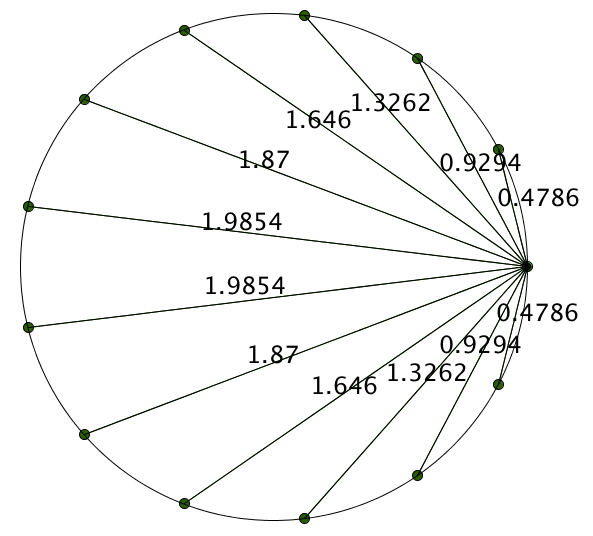
These are just approximations, but we have a nice conjecture here. If we have $n$ points spaced equidistant around a circle and measure drawn segments like we’re doing, we’re going to get a product of $n$.
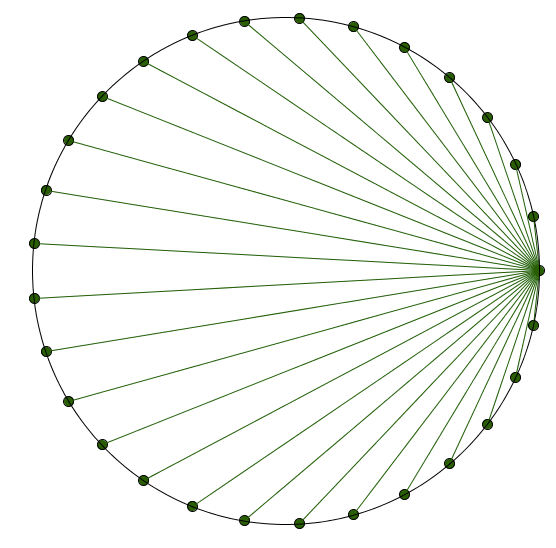
It turns out that this conjecture is true! Yup, if you super carefully multiply the lengths of these segments, you’re going to get an exact value of 29. MATH, Y’ALL!
And this has an elegant proof. But I just want you to take a moment to think about how ridiculous and unexpected this is… because would you ever have expected we’d get this perfect product?!? I never ever saw this coming. Math constantly has surprises in store for us. An unexpected equilateral triangle appearing? A product of segments that just seems to come out of nowhere? Love, love, love.
I’m going to show the proof below, because I know once you’ve seen something like this, something in the core of your being is crying out: But why?!?!?!?!?!? How could this be true?! It involves a little work on the complex plane. So if you aren’t quite familiar with this level math, that’s okay! Just knowing that someone out there has figured why this works is some sort of satisfaction in and of itself.
So for someone who has learned about the complex plane, this problem is begging for it to be seen in that world (roots of unity, anyone?). Let’s make things simple and deal with 5 equidistant points on the circle, but it can be generalized to $n$. Here we go:
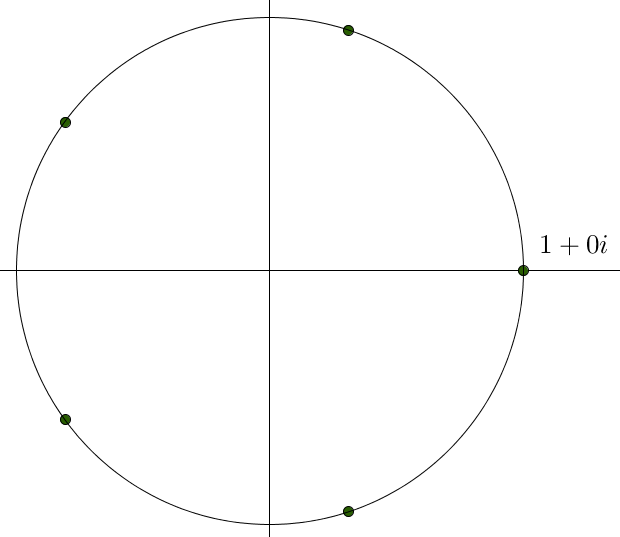
Now it turns out that the other four points in the complex plane can be found, because they are the four other complex solutions to $z^5=1$. (These are known as the fifth “roots of unity” and are all tied up with the one of the most unexpected identities in mathematics: $e^{i \theta} = \cos(\theta) + i \sin(\theta)$.)
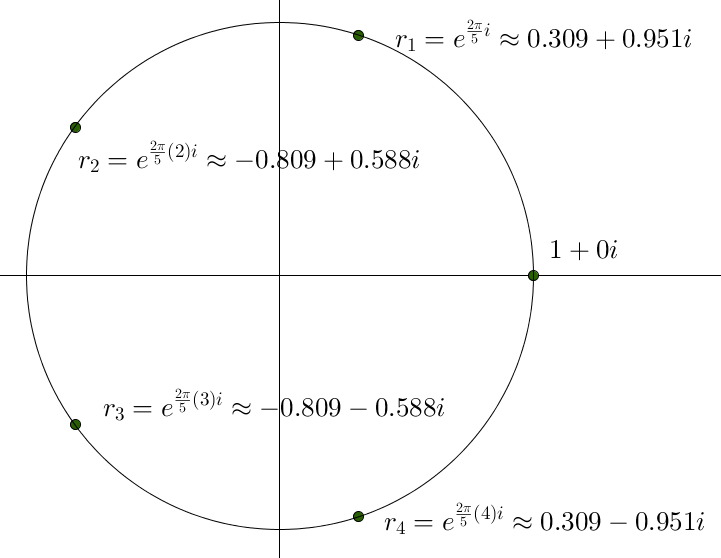
Wait a second. When we look at the roots of unity, we can see that $r_2 = r_1^2$ and $r3 = r_1^3$ and $r_4 = r_1^4$.
So let’s go with that, and just call $r_1 = r$.
So now let’s find the product of the segments:
I’m going to argue that the length of the red segment is the magnitude of the difference of the two complex points. Let’s calculate it: $|1-r| \approx |1-(0.309+0.951i)| \approx |0.691-0.951i| \approx \sqrt{(0.691)^2+(0.951)^2} \approx 1.176$.
It works! Maybe you can see this just ends up being the Pythagorean theorem (the change in the $x$-coordinates squared plus the change in the $y$-coordinates squared) if we were working on the regular coordinate plane and not the complex plane
The product of all the segments is then: $|1-r| |1–r^2| |1-r^3| |1-r^4| = |(1-r)(1-r^2)(1-r^3)(1-r^4|$
Now here’s as far as I know I could possibly get as a mathematician. But when I saw the proof, the next step was such a nice insight.
Let’s generalize this product to be the absolute value of this polynomial
\[\operatorname{ProductPoly}(z)=(z-r)(z-r^2)(z-r^3)(z-r^4)\]
evaluated when $z=1$. We want to know what this is. That’s our goal.
This polynomial gives four of the five roots of unity. It is just missing $z=1$ (the point we’re drawing all the segments from). But also, we know that $z^5-1$ is the polynomial that gives all five roots of unity. Ready for this?
So if we take $z^5-1$ and divide out the root $z=1$, we should get the polynomial that gives us the remaining four roots of unity. In other words:
\[ \frac{z^5-1}{z-1} = (z-r)(z-r^2)(z-r^3)(z-r^4) = \operatorname{ProductPoly}(z) \]
And by doing basic long division, we can see $\frac{z^5-1}{z-1} = z^4+z^3+z^2+z^1+1$.
Putting this all together: $\operatorname{ProductPoly}(z) = (z-r)(z-r^2)(z-r^3)(z-r^4) = z4+z3+z2+z1+1$.
And our goal was to find the absolute value of $\operatorname{ProductPoly}(z)$ when $z=1$.
$\operatorname{ProductPoly}(1) = (1-r)(1-r^2)(1-r^3)(1-r^4) = 1^4+1^3+1^2+1^1+1=5$.
And the absolute value of 5 is 5.
Fin.
PS. Credit to showing me this problem goes to Bowen Kerins and Darryl Yong in 2010. They also suggested an extension to an ellipse that involves, believe it or not, the Fibonacci numbers! Extra special thanks to Ben Blum-Smith and Japheth Wood who saw the problem on my blog and wrote a whole paper on it, and finally put me out of my misery for understanding how and why this result falls out naturally.
PPS. I wanted to test things out if I put $z=2$ into $\operatorname{ProductPoly}(z)$. By the algebra, the product of the segments should be $2^4+2^3+2^2+2^1+1=31$. And indeed, when I looked at the associated diagram and found the product of the approximate lengths of the segments…
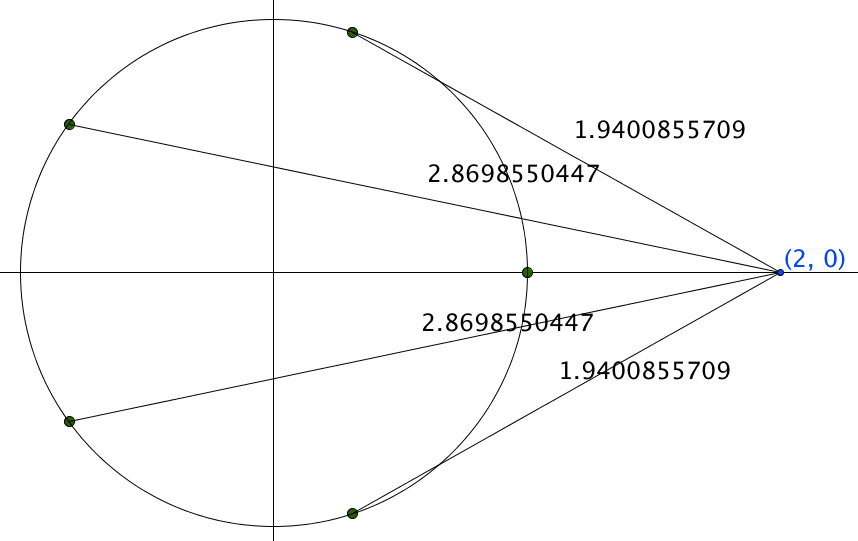
… I got 30.9999999999. Huzzah! Even though I know it should work, I love seeing it happen!
So, which bit of maths do you want to win? Vote now!
Match 18: Group 2 - Marianne and Rachel vs Sameer Shah
- Sameer with points on circles
- (85%, 142 Votes)
- Marianne and Rachel with Fourier transforms
- (15%, 26 Votes)
Total Voters: 168
This poll is closed.
The poll closes at 9am BST on the 19th. Whoever wins the most votes will win the match, and once the group stages are over, the number of wins will determine who goes through to the semi-final.
Come back tomorrow for our nineteenth match of the group stages, featuring Vicky Neale and Sunil Singh. Or check out the announcement post for your follow-along wall chart!