The group stage is over, and now we’re only three matches away from finding the World’s Most Interesting Mathematician (2019 edition, of the 16 people who were asked to take part and were available in July).
For the first semi-final, from group 1 it’s Lucy Rycroft-Smith up against the winner of group 2, Sameer Shah. The pitches are below, and at the end of this post there’s a poll where you can vote for your favourite bit of maths.
Take a look at both pitches, vote for the one that made you do the loudest “Aha!”, and if you know any more cool facts about either of the topics presented here, please write a comment below!
Lucy Rycroft-Smith – Your maths is on fire

Lucy Rycroft-Smith is a researcher and writer at Cambridge Maths (an organisation creating an innovative map of school mathematics 3-19). She was a maths teacher for ten years across primary, secondary and HE and is the co-editor of Flip the System UK: A Teachers’ Manifesto. She’s @honeypisquared on Twitter.
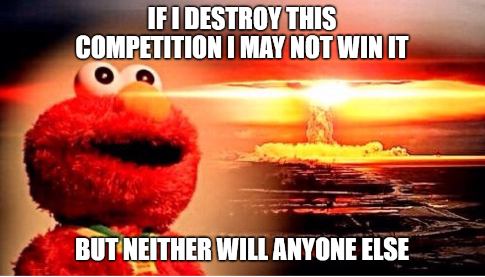
The premise of this competition is to find and explain cool maths things. I promised that if I got through the group stage I would – and I quote my own foolish words – ‘BURN THE HOUSE DOWN.’ No, not arson, just arsey – I plan to strike not a literal match, but a metaphorical one. Against my maverick, greying five-day-old stubble. Then toss it casually behind me and WALK AWAY COOLLY FROM THE ENSUING EXPLOSION.

What am I burning? Glad you asked. I’d like to set fire to the absurd notion of finding cool maths things, please – yes indeedy, the very premise this competition is built on. Will it collapse and the resultant butterfly effect ensure I, and indeed no-one else, can ever win?
Possibly. Am I going to do it anyway? You betcha, Tom Fletcher. Am I also going to continue to use this rhyming celebrity structure throughout? Sure as hell, Patti LaBelle.I like maths. I like talking and writing about maths. (I also quite like singing about it and doing plays about it and writing jokes about it). But here’s the catch, B-Dick C-Batch: the more I read and hear about maths, the more it feels like the ‘cool maths stuff’ we are sharing in our community can feel cliquey, repetitive, elitist and sneering, like a mean girls film (Mean Girls 4: No-One Likes The Mode Anymore, It’s Like So Totally Out of Fashion).

I am placing no blame. We are, I suspect, community-building by rehearsing and repeating, fetishizing and ritualising. I understand that we can’t always start from the very beginning; I get that no-one wants to dumb down their subject. But I also think we are doing mathematics no favours by, at times, ignoring the easy wins we can borrow from elsewhere: strong, beautiful, well-designed visuals; humour; taking apart the simplest of concepts in a new, thoughtful way ; commonly-understood analogy; harnessing emotion; creative risks. Now you’re talkin, Christopher Walken.
I also think we all too often regurgitate rather than create. Instead of looking for connections, playing with something, taking our time, adding to the field in some small way, we simply show: we are all steak and no sizzle. We are serving a gourmet meal, without ceremony, on a dustbin lid. Sure, it’s delicious, but no-one’s going to taste it unless we give much more thought to the presentation, the ambience, the experience. Nice try, Stephen Fry.

The assumed audience seems to be the already robed and waiting choir of mathematicians, some of whom then leap to the dismissive ‘yes, I’ve seen that’ or ‘it’s a trivial result’ or – the absolute worst of all – ‘ha ha ha: the rest is left as an exercise to the reader.’ In-jokes abound, Ezra Pound. This may well stem from insecurity – who am I to add to the great sum of knowledge of mathematics? – rather than the opposite, but it means we are missing out on so much fun. And what’s the point in that, Postman Pat? (I panicked).

If all this comes across as aggressive and critical, I’m sorry. There are many, many people doing this stuff already, much better than I am, and some of them are in this competition. But we are so constrained by perceptions of what ‘an article about a cool piece of maths’ should look like that maybe we are not seeing anything like what we might be capable of. Despite the high profile of many of the mathematicians participating, we’re getting at best hundreds of votes per article. Why not thousands, or tens of thousands? Is that even important?
Well, maybe. I’m arguing that it’s time to stop collecting a bag of shiny cool maths things and chuckling over them, furtively and smugly, with only the other mathematicians who have proven themselves worthy. I’m arguing that it’s time to stop using knowledge tests about maths and mathematicians to keep people out of the inner circle. (If you don’t believe me, someone once yelled, at room-silencing volume, ‘You haven’t heard of CANTOR SETS?!’ at me at a conference.) I’m arguing that it’s time to recognise that the privilege of being someone who has somehow made it as a mathematician should give us not a sense of entitlement, but a sense of humility and duty towards those not so fortunate. I’m arguing that instead of sizing people up when they ask us ‘stupid’ questions about our work, we should delight that they care and answer then gently and thoughtfully. I’m especially arguing that people in the field of ‘mathematics’ and ‘mathematics education’ and ‘mathematics communication’ should be working together and learning from one another a great deal more. Explaining something beautifully and emotively and with vision and energy and creativity and sometimes great, great simplicity is such an important skill, and a vital one to the propagation of the love of our subject; it’s just too important not to care about. *Jumps on chair and stares into the distance* I’m arguing for maths for the masses, Reem Kassis.
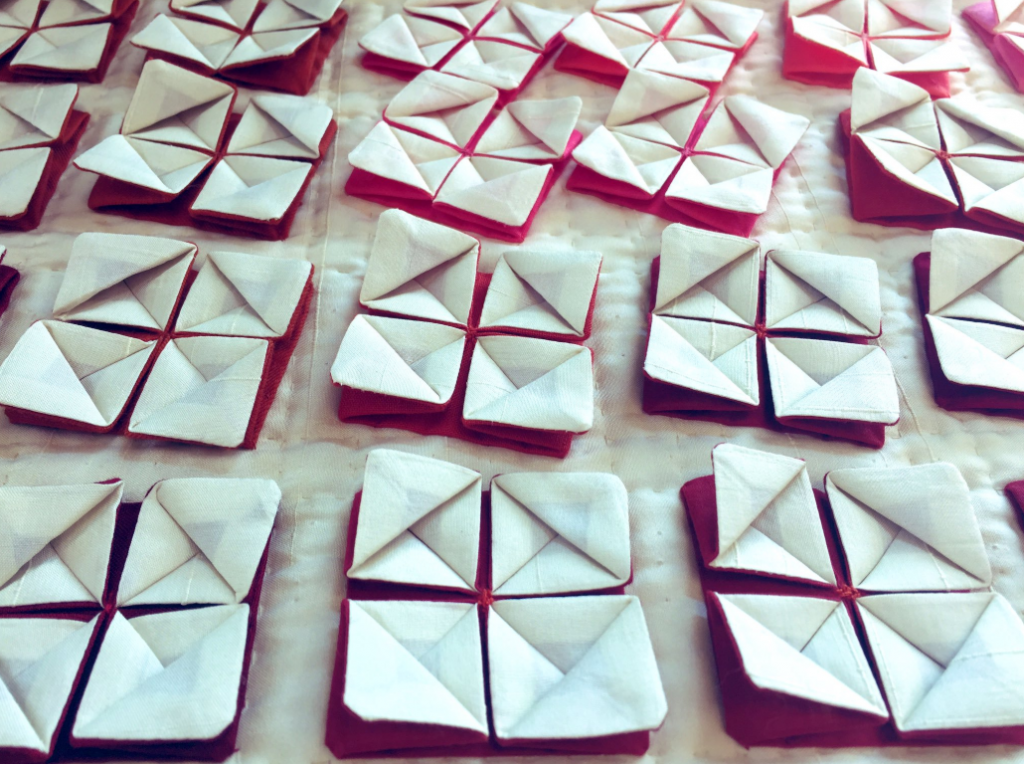
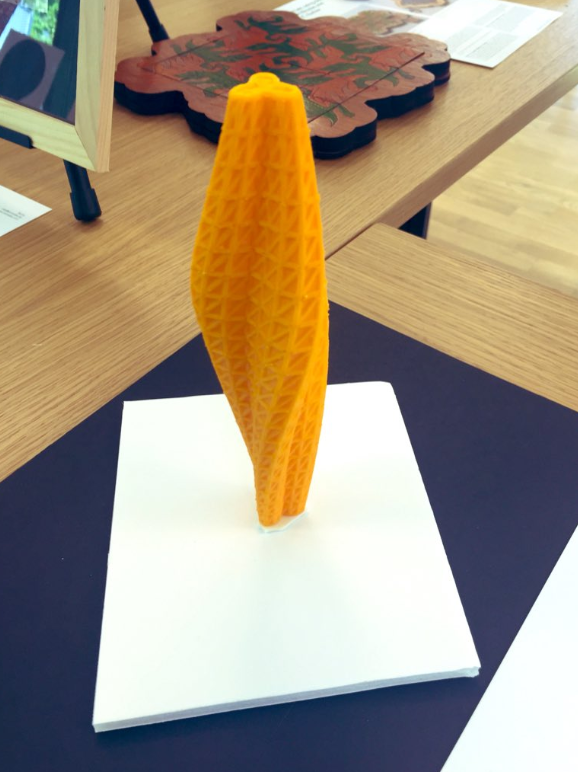
More specifically, I’m calling for mathematicians to make more stuff. Take more risks. Innovate, not just replicate (Catherine Tate). This may have had something to do with the fact that I’ve just spent a week at the Bridges Maths and Art conference, surrounded by inspiring and beautiful ideas about mathematics that have innovation at their core. Look at this beautiful stuff:

The idea being not just ‘ooh, this is a cool piece of maths’ but ‘ooh, this is a cool new way of seeing a piece of maths that I have riskily made my own’. Let’s move away from the former, Natalie Dormer – and towards the latter, Sep Blatter.

Inventing new mathematics is always going to be the preserve of the lucky and dedicated few. Inventing new ways to look at old mathematics, new connections, new visualisations and new ways of using tech, not just to explain, but to allow much wider access to otherwise esoteric ideas – that’s for everyone. And I mean everyone, Kim-Jong Un. And there’s value in that – oh-so-much value.
Here’s an example – you may have noticed that I have been peppering this article with memes. (If you want to read more about mathematical memes, this paper is really good.) Why? They’re a short, accessible, hopefully funny way in; they break up the text; they’re assuming knowledge, but it’s not just or always mathematical (also social and cultural, since you ask). They are a different way in. Best of all, if you don’t get it, you can just skip past – they are not central to the point. Just some glittery icing on the cake, Ricki Lake.
Good art – cinema, music, fiction, Netflix series – works on multiple levels. No-one has to get all the references or understand all the expert touches; the low threshold of most things we label ‘entertainment’ makes them extra appealing to a wider audience, who neither need nor should receive censure for not totally ‘getting it.’ Let me tell you a secret: no-one ever totally gets it. Everything is complicated, and the intention of the creator of anything at all is never fully realised; a translation, a transaction takes place between maker and receiver, which is not incidental to the object itself but is part of it, is indeed the point. Mathematicians might recognise this as a type of anti-Platonic argument about abstraction; artists will have a view on it too that may incorporate ideas about the sublime and the artistic. Many of the concepts are very much the same. We’re all just making stuff out of ideas, after all.
So: I need to modify my conjecture. I don’t really want to watch the Math Off burn; just to destroy the constraining expectations of what the pitches could or should look like – and more importantly, feel like. I am willing to bet that many of my competitors have been worrying themselves sick over what to include in their pitches: whether it is ‘mathy’ enough, whether it might threaten or sustain their identity as a ‘mathematician’; whether they are worthy enough to stand beside the others. Well, enough. I started this pitch with humour, but I am ending it deadly serious. Well, ish.

The imagery of burning has been all around me this week. I was in a play about Johannes Kepler, in which women were tortured and burned for not fitting male expectations about the way they should think and behave. I have been reading articles like this by Calvin Smith about how putting Alan Turing on a £50 note doesn’t suddenly ‘fix’ the way he was treated: ’a Turing banknote cannot be allowed to become a pinkwashed sticking plaster over the underlying issues of intolerance.’ Calvin calls July ‘LGBT wrath month’ and notes his ‘seething rage’ over the continued injustice against LGBT+ people all over the world. Turing was in many senses burned, too – chemically castrated for the ‘crime’ of being gay.
I have been reading about feminist play Emilia, which considers the fate of forgotten and invisible and scorned women; I think the world has been similarly full of forgotten and invisible and scorned mathematicians, who have never had the chance to show the world their ‘cool stuff’ because it didn’t fit, or more likely they didn’t fit. We are all complicit. That makes me sad; but more powerfully, it makes me angry. And I will not apologise for that. Sometimes we need to break the rules. Rules are just algorithms that people decide other people should follow. Compliance isn’t always ethical or even smart. Some destruction may be necessary in order to start again from fair.
So – this isn’t ‘a piece of cool maths’, not at all. It’s a hot take on a burning issue about access and gatekeeping and inclusion and media and methods. It’s about gathering courage to find your fire and take a risk and fan the flames of others who are doing the same. It’s about the simple incendiary power of ‘what if’.
I leave you with Emilia’s words:
‘If they try to burn you, may your fire be stronger than theirs so you can burn the whole fucking house down.’
Sameer Shah – Round 4

Sameer Shah has been teaching high school math in Brooklyn for the past twelve years. You can read his musings about his classroom at Continuous Everywhere but Differentiable Nowhere. He’s @samjshah2 on Twitter.
My theme in this competition is the unexpected, and the awe that comes out of it. Today I want to share with you the miracle of pattern breaking. Like when someone asks you what should come next in that pattern: 1, 2, 4, 8, 16, ___. You’d likely say 32, which is a totally legit answer. But just as logical and legit is 31. I’m guessing if you said 31, you have seen this famous pattern breakdown before . It goes like this: if you have a circle and connect $n$ points, the number of regions created follows this numerical sequence (image from here and explanation here):
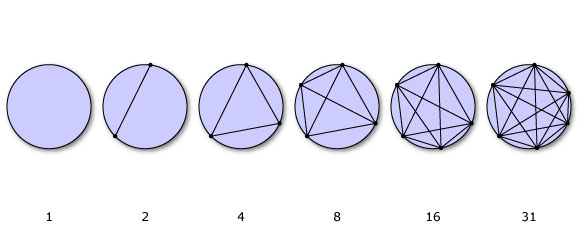
And I love that this misleading sequence forced my brain to explode and then made me hunger to figure out why this pattern broke at this particular place. Similarly, when I was in high school, I learned that you could algebraically (using addition, subtraction, multiplication, division, and roots) solve any linear, quadratic, cubic, or quartic polynomial generally, but somehow the pattern broke there
The cubic polynomial has a storied history. One of the most interesting youtube series I’ve seen is on complex numbers, and goes through some of this history.
Sadly I’ve grown old and feeble mathematically, and couldn’t open an abstract algebra book now and understand much. So I don’t quite honestly know conceptually anymore why the pattern breaks. But this website might be understandable even to me, so in the next few weeks I’m going to try to re-understand something lost from my youth!
So here’s today’s post. It’s about something that was making the rounds on twitter a few months ago that made me go whaaaa the whaaaa?! It is this pattern which maybe you’ve also seen floating in the interwebs:
\begin{align}
\int_0^\infty \frac{\sin x}{x} = \frac{\pi}{2} \\
\int_0^\infty \frac{\sin x}{x} \cdot \frac{\sin \frac{x}{3}}{\frac{x}{3}} = \frac{\pi}{2} \\
\int_0^\infty \frac{\sin x}{x} \cdot \frac{\sin \frac{x}{3}}{\frac{x}{3}} \cdot \frac{\sin \frac{x}{5}}{\frac{x}{5}} = \frac{\pi}{2} \\
\int_0^\infty \frac{\sin x}{x} \cdot \frac{\sin \frac{x}{3}}{\frac{x}{3}} \cdot \frac{\sin \frac{x}{5}}{\frac{x}{5}} \cdot \frac{\sin \frac{x}{7}}{\frac{x}{7}} = \frac{\pi}{2} \\
\int_0^\infty \frac{\sin x}{x} \cdot \frac{\sin \frac{x}{3}}{\frac{x}{3}} \cdot \frac{\sin \frac{x}{5}}{\frac{x}{5}} \cdot \frac{\sin \frac{x}{7}}{\frac{x}{7}} \cdot \frac{\sin \frac{x}{9}}{\frac{x}{9}} = \frac{\pi}{2} \\
\int_0^\infty \frac{\sin x}{x} \cdot \frac{\sin \frac{x}{3}}{\frac{x}{3}} \cdot \frac{\sin \frac{x}{5}}{\frac{x}{5}} \cdot \frac{\sin \frac{x}{7}}{\frac{x}{7}} \cdot \frac{\sin \frac{x}{9}}{\frac{x}{9}} \cdot \frac{\sin \frac{x}{11}}{\frac{x}{11}} = \frac{\pi}{2} \\
\int_0^\infty \frac{\sin x}{x} \cdot \frac{\sin \frac{x}{3}}{\frac{x}{3}} \cdot \frac{\sin \frac{x}{5}}{\frac{x}{5}} \cdot \frac{\sin \frac{x}{7}}{\frac{x}{7}} \cdot \frac{\sin \frac{x}{9}}{\frac{x}{9}} \cdot \frac{\sin \frac{x}{11}}{\frac{x}{11}} \cdot \frac{\sin \frac{x}{13}}{\frac{x}{13}} = \frac{\pi}{2}
\end{align}
And then… OMG YOU GUESSED IT CORRECTLY!… we have:
\[ \int_0^\infty \frac{\sin x}{x} \cdot \frac{\sin \frac{x}{3}}{\frac{x}{3}} \cdot \frac{\sin \frac{x}{5}}{\frac{x}{5}} \cdot \frac{\sin \frac{x}{7}}{\frac{x}{7}} \cdot \frac{\sin \frac{x}{9}}{\frac{x}{9}} \cdot \frac{\sin \frac{x}{11}}{\frac{x}{11}} \cdot \frac{\sin \frac{x}{13}}{\frac{x}{13}} \cdot \frac{\sin \frac{x}{15}}{\frac{x}{15}} = \frac{467807924713440738696537864469 \pi}{935615849440640907310521750000} \approx 0.9999999999852937186 \frac{\pi}{2} \]
Okay, okay, obviously you didn’t guess that. It is CRAZY and UNEXPECTED and BEGS THE QUESTION (in the whiniest of voices): Whyyyyyyyyyyyyy? What the heck is going on here?
If you’re like me, you immediately want to see what those functions in the integrals look like. Here they are. The signed area of each of these is exactly $\pi/2$. Well, except for the last image in the gif, which has that other weirdo value.
I decided for this pitch, I was going to try to immerse myself into conceptually understanding why the pattern breaks down for the last integral. I wanted to figure out: why do things break down there specifically? Now truth be told, I am a high school math teacher and I didn’t fully recognize what I was getting myself into as I started scouring the interwebs for help. But I think I found a way to conceptually understand why the pattern breaks in the eighth integral. This post is my attempt to share what I’ve figured out with you, but with some handwaving to focus on the big picture. If you leave this post saying “okay, I don’t have all the details, but I now I kinda get why things break down and it doesn’t feel like black mathemagic anymore” I’ll feel so dang proud, because it took me many hours to piece this together.
Surprisingly, the best way I could understand what was happening was when I saw how this problem could be looked at in a different mathematical “world.” The world we’re going to look at is the world of random walkers. Don’t worry, friend, we’ll see how this all connects to the original problem soon enough.
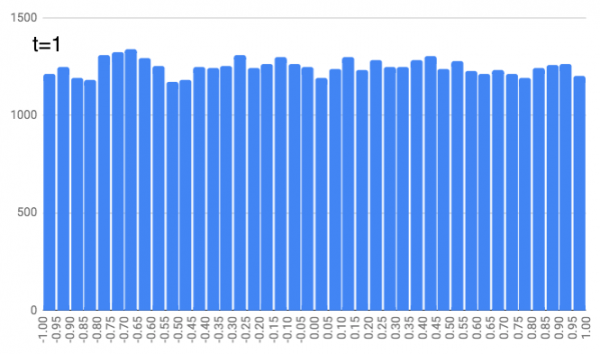
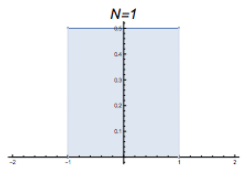
Imagine a number line. At time $t=0$, picture 50,000 people standing at the origin of that number line. And at $t=1$, people ask a random number generator to pick any number between -1 and 1 and move that distance (forwards if positive, backwards if negative). So some people will end up at 0.6129 and others will end up at -0.8518 and some will stay at 0. I actually ran a simulation and made a histogram of where 50,000 people will end up. Pretty uniform!
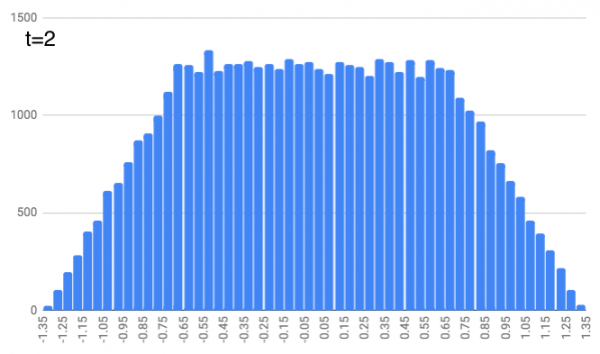
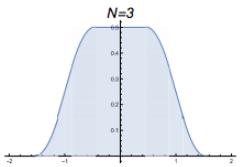
Now at $t=2$, we ask each person to use a random number generator to pick any number between -1/3 and 1/3 and move that distance from where they were standing at $t=1$. (So if they were at 0.2451 and they picked -0.1423, they’d end up at 0.1028) Everyone shuffles along. This is where people ended up in my simulation. It’s like a trapezoid!
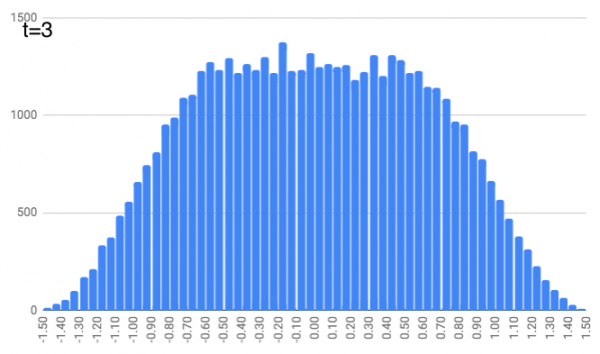
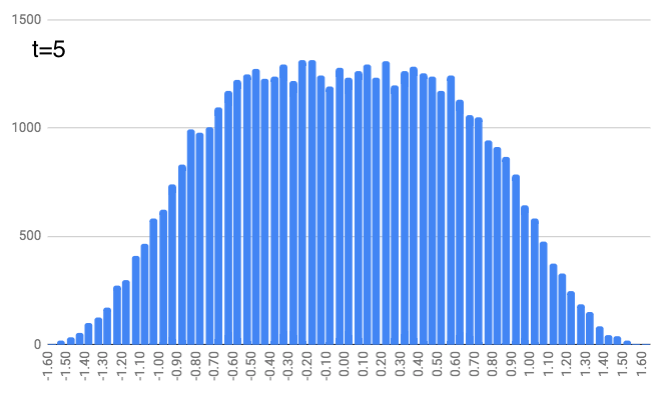
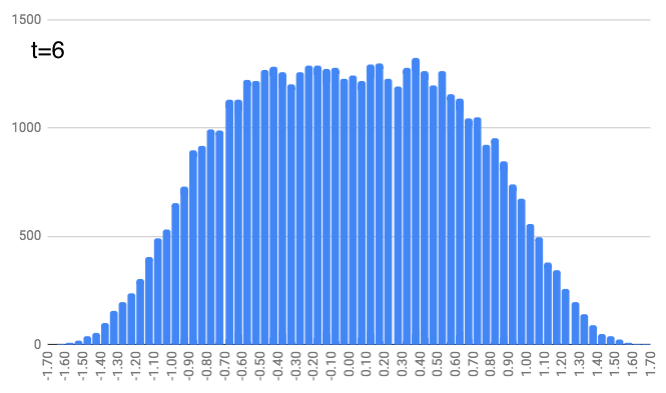
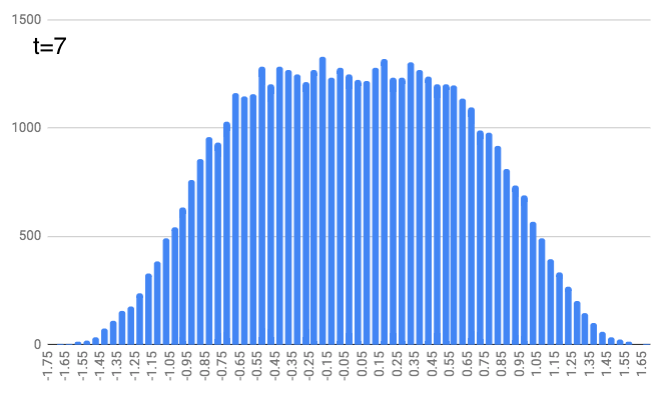
At $t=3$, we do this again, except people pick a random number between -1/5 and 1/5 and shuffle along from their previous position. It’s getting a little more curvy.
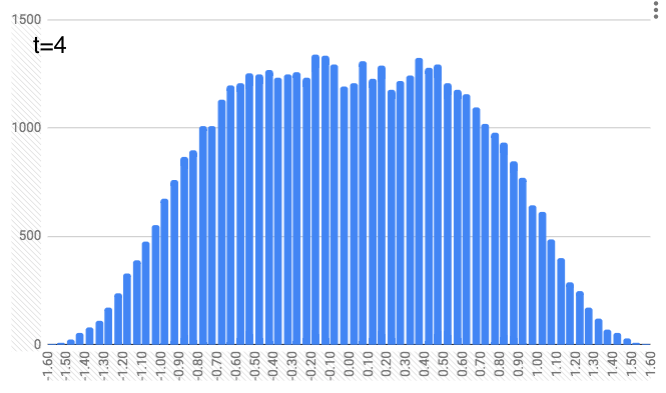
At $t=4$, this repeats but with a random number between -1/7 and 1/7. And this continues, with $t=5$ and random numbers between -1/9 and 1/9… $t=6$ with random numbers between -1/11 and 1/11… $t=7$ with random numbers between -1/13 and 1/13… and finally $t=8$ with random numbers between -1/15 and 1/15. You can see the locations look like they define a slightly curvier curve as we increase the time. (As a quick aside, just notice that these numbers (1, 1/3, 1/5, 1/7, …, 1/15) are the same as the coefficients in the integrals above. We’ll come back to that.)

To be super concrete about this, here are some locations of a few of the 50,000 people at different times:
| $t=1$ | $t=2$ | $t=3$ | $t=4$ | $t=5$ | $t=6$ | $t=7$ | $t=8$ |
| -0.6940916115 | -0.4781476617 | -0.6521794967 | -0.5476115243 | -0.4609971277 | -0.3944858794 | -0.4108021093 | -0.4642781841 |
| 0.0968716913 | -0.2241373435 | -0.04979952551 | -0.1366607535 | -0.08138570877 | -0.03362843591 | 0.0380200262 | 0.009439802107 |
| -0.5979006489 | -0.5804799382 | -0.585523837 | -0.6311622375 | -0.5919386863 | -0.5045473177 | -0.5704595957 | -0.5551915468 |
| -0.9858309829 | -0.993709489 | -1.126364886 | -1.247418513 | -1.332131918 | -1.37499405 | -1.431582764 | -1.42422592 |
People move a lot (on average) for the earlier time steps. And as we get further along in time, people just nudge their location a bit, but it doesn’t change dramatically (since the random number generator is choosing from smaller and smaller intervals).
If we wanted the idealized distribution (if we started out with a zillion people), I was thrilled to see a paper on this problem showed the actual curves for the first three times. How fun to see what I generated show up in a real published math paper!
The core ideas that I grappled with came from this illuminating blogpost which goes through an argument given in a paper by Majumdar and Trizac.
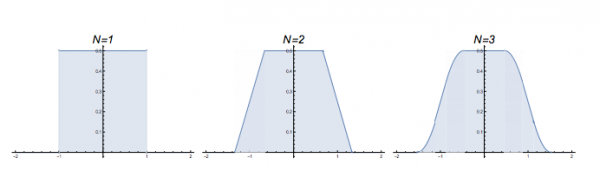
Now to be clear, these are not quite what I generated. Not only are they idealized, but they are “probability density functions” for the random walkers. In other words, each has an area of 1, meaning 100% of the walkers will be in this blue area of the number line. If we wanted to find the total percentage of walkers on the number line between -0.123 and 0.242, we’d find the total blue area in between those numbers, and that area would tell us what percentage of walkers are in that region on the number line. Also notice that these three graphs (at $t=1$, $t=2$, and $t=3$) have a completely flat plateau at the top, but that plateau shrinks in length as time goes on.
We’ve travelled down a bit of a detour with this talk about random walkers, and you might be wondering how it all ties up with the original integration problem. Here’s where we’re going to make the connection! In math, we sometimes can look at things from two different mathematical worlds, and sometimes one world is easier to work with than another. For example, a curve like $y=\cos(x)$ looks like a wave when graphed. But in the polar world, the curve $r=\cos(\theta)$ looks like a circle when graphed. Two different mathematical worlds, but sometimes one world is easier to work with or understand than the other — depending on the problem.
The same thing is happening here. As you might have suspected, the random walk probability density functions are related to the functions in the original integrals. They actually are exactly equivalent, but they lie in two different worlds.
It turns out if we convert the random walk probability density curves using something called the Fourier transform, we get a curve in a different mathematical world which are exactly equivalent to the functions in the original integrals. They look different because they lie in two different mathematical worlds, but they both represent the same thing. HOLY COW! MATH, Y’ALL!
| Mathematical World 1: The random walk probability density functions | Mathematical World 2: The equivalent functions in the other world |
 At $t=1$, the probability density distribution from where people started at $x=0$ and then randomly moved to a number between -1 and 1. | 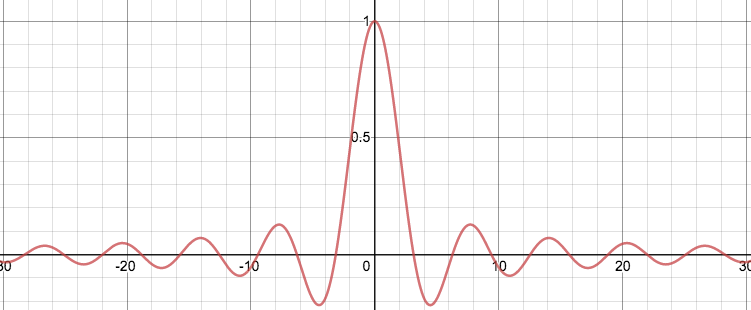 The graph of $\frac{\sin(x)}{x}$ |
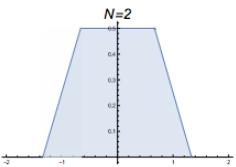 At $t=2$, the probability density distribution from where people moved from their position at $t=1$ to a new place by randomly choosing a number between -1/3 and 1/3 and moving that amount. | 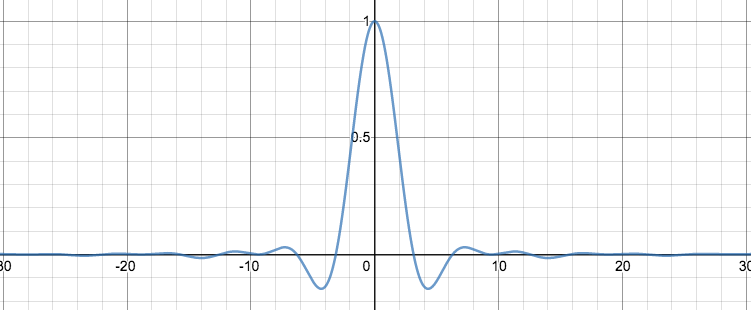 The graph of $\frac{\sin(x)}{x}\frac{\sin(1/3 x)}{1/3 x}$ |
 At $t=3$, the probability density distribution from where people moved from their position at $t=2$ to a new place by randomly choosing a number between -1/5 and 1/5 and moving that amount. | 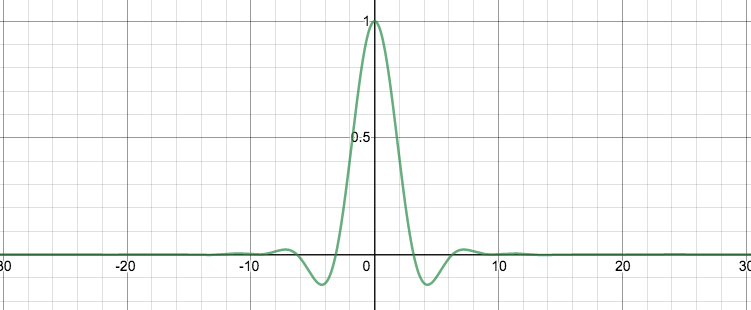 The graph of $\frac{\sin(x)}{x}\frac{\sin(1/3 x)}{1/3 x}\frac{\sin(1/5 x)}{1/5 x}$ |
And now for something even more impressive, and this is where some hand-waving comes in. Fourier transforms involve us moving from one mathematical world into another by taking an integral. Because of that, by knowing the value of a function in one world, we actually can tell something about the integral of the function in the other world! In fact, it turns out that the integral of the function on the right (from $-\infty$ to $+\infty$) is simply $2\pi \cdot (\text{the height of the function on the left at} x=0)$
The technical reason for this comes from this property of Fourier transforms.
Since for $t=1$, $t=2$, and $t=3$ we see the height of the function on the random walk function at $x=0$ is 1/2, we conclude that the integrals have a value of $2\pi(1/2) = \pi$. So:
$\int_{-\infty}^{\infty} \frac{\sin(x)}{x}\,dx = \pi$ and $\int_{-\infty}^{\infty} \frac{\sin(1/3 x)}{1/3 x}\,dx = \pi$ and $\int_{-\infty}^{\infty} \frac{\sin(1/5 x)}{1/5 x}\,dx = \pi$
But since the original integrals we were given only asks for half of these integrals we’ve calculated (we only wanted the integrals from $0$ to $+\infty$), we can conclude that the integral we care about is equal to $\pi \cdot (\text{the height of the function on the left at } x=0)$:
$\int_{0}^{\infty} \frac{\sin(x)}{x}\,dx = \pi/2$ and $\int_{0}^{\infty} \frac{\sin(1/3 x)}{1/3 x}\,dx = \pi/2$ and $\int_{0}^{\infty} \frac{\sin(1/5 x)}{1/5 x}\,dx = \pi/2$
OMGosh!!! Believe it or not, we’re so dang close to being done!!! We now have a way to find the value of these integrals in the original problem! We just have to keep on evaluating the random walk functions at $x=0$ for different $t$ values, not just for $t=1$, $t=2$, and $t=3$. So let’s look carefully at the graphs for these random walk functions at various times and see what happens to it!
The graphs at $t=1$ start by having a long plateau at 1/2 (drawn in red), but we see that the plateaus in these graphs are getting shorter and shorter as time goes on. The plateau erodes at the edges. And after a certain point, the plateau won’t exist anymore, and the graph won’t actually quite get to a height of 1/2 (though it is quite close). (This beautiful gif illustrating this phenomenon was found here.)
It turns out that one can calculate the length of this plateau after $t$ seconds, and it diminishes like so:
| Time | Length of Plateau (with a height of 1/2) |
| $t=1$ | $2(1)=2$ |
| $t=2$ | $2(1-1/3) \approx 1.333$ |
| $t=3$ | $2(1-1/3-1/5) \approx 0.933$ |
| $t=4$ | $2(1-1/3-1/5-1/7) \approx 0.648$ |
| $t=5$ | $2(1-1/3-1/5-1/7-1/9) \approx 0.425$ |
| $t=6$ | $2(1-1/3-1/5-1/7-1/9-1/11) \approx 0.244$ |
| $t=7$ | $2(1-1/3-1/5-1/7-1/9-1/11-1/13) \approx 0.090$ |
| $t=8$ | ACK! We get a negative value! There is no more plateau! |
And in fact, because the plateau disappears at $t=8$, we also know that the height at $x=0$ on this graph will not reach 1/2. I present to you the height at $t=8$ exactly (found on Wikipedia):
\[ \frac{1}{2} \left( 1 – \frac{\left( \frac{1}{3} + \frac{1}{5} + \frac{1}{7} + \frac{1}{9} + \frac{1}{11} + \frac{1}{13} + \frac{1}{15} – 1 \right)^7}{2^6 \cdot 7!\left(\frac{1}{3}\cdot\frac{1}{5}\cdot\frac{1}{7}\cdot\frac{1}{9}\cdot\frac{1}{11}\cdot\frac{1}{13}\cdot\frac{1}{15}\right)}\right) = 0.499999999993 \]
\[ \frac{467807924713440738696537864469}{935615849440640907310521750000} = 0.499999999993 \]
So dang close to 1/2! It just slightly dips below! And dang it! We’ve seen that fraction before! We said the value of the integral from 0 to infinity is $\pi(\text{the height of the function on the left at } x=0)$, so:
\[ \int_0^\infty \frac{\sin x}{x} \cdot \frac{\sin \frac{x}{3}}{\frac{x}{3}} \cdot \frac{\sin \frac{x}{5}}{\frac{x}{5}} \cdot \frac{\sin \frac{x}{7}}{\frac{x}{7}} \cdot \frac{\sin \frac{x}{9}}{\frac{x}{9}} \cdot \frac{\sin \frac{x}{11}}{\frac{x}{11}} \cdot \frac{\sin \frac{x}{13}}{\frac{x}{13}} \cdot \frac{\sin \frac{x}{15}}{\frac{x}{15}} = \frac{467807924713440738696537864469 \pi}{935615849440640907310521750000} \approx 0.9999999999852937186 \frac{\pi}{2} \]
The authors of the Majumdar and Trizac paper have the most glorious argument that I can’t delve into now. It also explains the length of the shrinking plateau. In essence, it boils down to: if a random walker goes maximally away at $t=1$ so they end up at $x=1$, how many moves will it take for the random walker to get back to the origin? In this case, it would mean the walker would have to move backwards 1/3, then 1/5, then 1/7, etc., and they could get back to the origin at $t=8$ at the earliest. That corresponds with the final crazy integral that breaks down. They have an argument (best seen in this video, from 13:18 to 15:14) that explains this argument beautifully, that I don’t have time to write about but want to invite you to watch.
Yes, this was longish and isn’t a complete proof. You can read the fancy papers in the sidenotes for that. But this post outlines one beautiful approach that shows why the pattern lives, and then dies. And I, at least, am satisfied and the world makes sense yet again.
So, which bit of maths do you want to win? Vote now!
Match 25: Semi-final 1 - Lucy Rycroft-Smith vs Sameer Shah
- Sam with an unexpected chord progression
- (58%, 241 Votes)
- Lucy with FIRE
- (42%, 171 Votes)
Total Voters: 412
This poll is closed.
The poll closes at 9am BST on the 27th. Whoever wins the most votes will win the match and go through to the final.
Come back tomorrow for the second semi-final, featuring the winners of groups 3 and 4. Or check out the announcement post for your follow-along wall chart!