Martin Gardner’s long-running column in Scientific American made it onto the front cover of the magazine twelve times. Gathering 4 Gardner refers to these cover stories as “A Gardner’s Dozen“, while pointing out that these aren’t his ‘greatest hits’ and the magazine artists didn’t necessarily reproduce the graphics as he would have liked them.
Nevertheless, I thought it would be a fun challenge to try to reproduce these in TikZ, a drawing package for LaTeX. I like TikZ, and appreciate a chance to practice my skills. Readers of the future will be able to judge how many of the dozen I produced, and how regularly I did these.
The first I chose is the cover from November 1969. Last summer I had the pleasure of visiting Scarthin Books in Cromford, Derbyshire while walking along the Derwent with my son. Inside I found a small pile of old copies of Scientific American and thought it would be nice to own a copy with an original Martin Gardner article. Naturally, I chose the issue they had where his article provided the cover image.
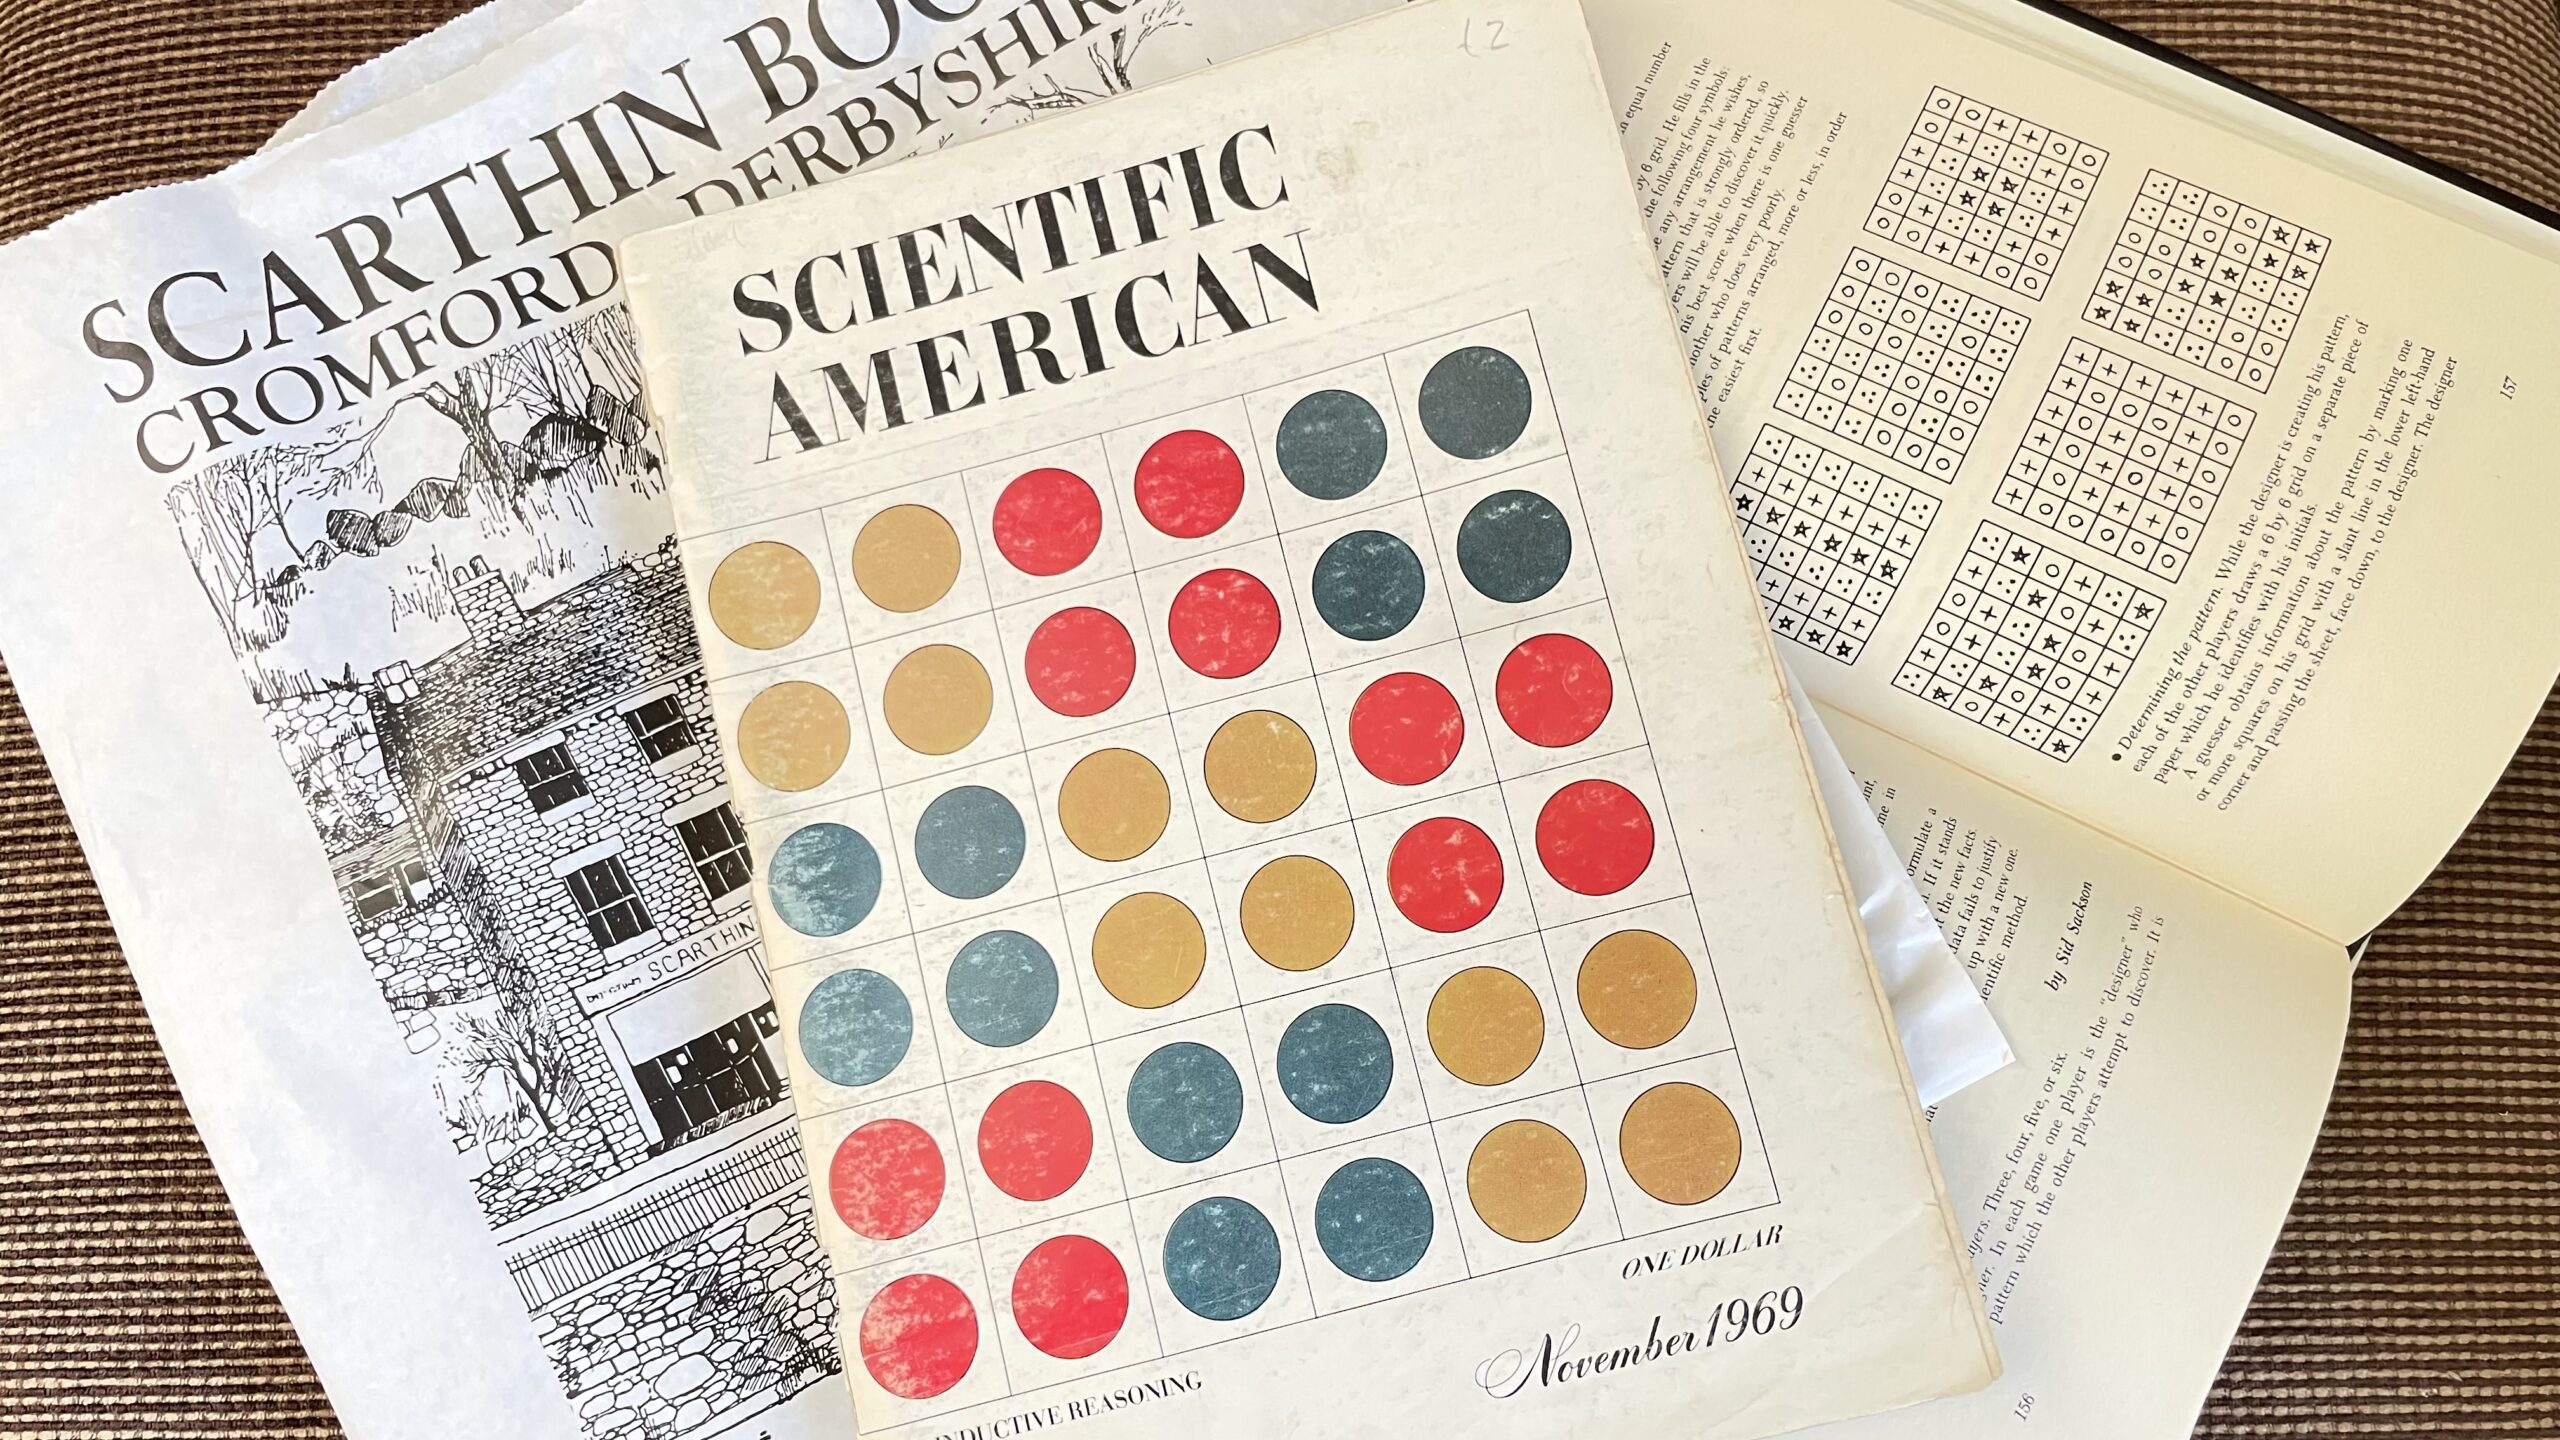
The cover says ‘Inductive Reasoning’, though the article inside is titled ‘A new pencil-and-paper game based on inductive reasoning’, republished in Mathematical Circus as ‘Patterns of Induction’. The article discusses several games including one called ‘Patterns’ from Sid Sackson’s A Gamut of Games (actually one of two totally different games confusingly called ‘Patterns’ in the book; this one is ‘Patterns II’). The game involves one player (the Designer) laying out a pattern on a grid in secret. The other players may request to view any of the cells, but score better if they use less information to guess the pattern. Gardner has this as the players making observations and using inductive reasoning to produce a hypothesis, which can be tested using further observations – a process of scientific discovery.
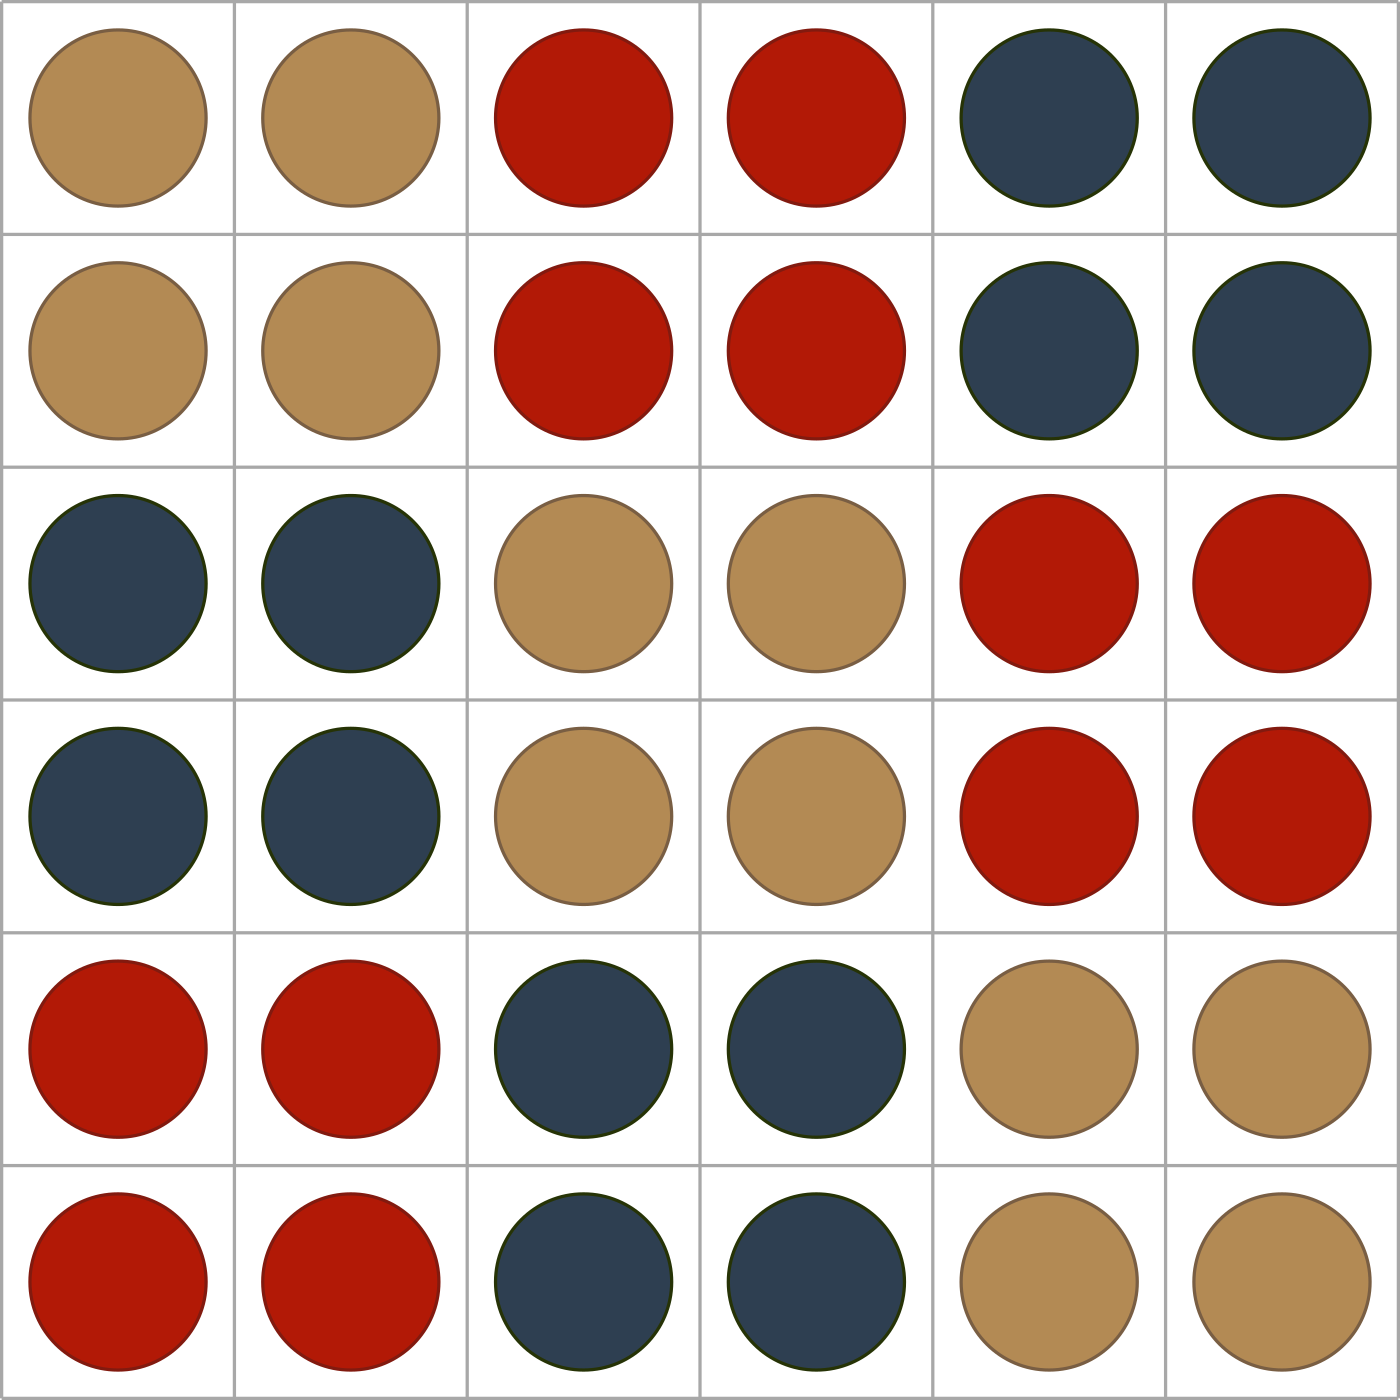
The pattern used in the cover image is one of the example patterns from Sackson’s book reproduced in the article. Really, it’s a pretty graphic, rather than saying anything meaningful about the content of the article. To my eye, it is a three-by-three Latin square in which the components are differently-coloured sets of four circles. You may, of course, see it differently – but that’s how I saw it, so that’s how I coded it.
TikZ is a LaTeX package which provides an environment, so the basic code for a TikZ image is like this.
\documentclass{standalone}
\usepackage{tikz}
\begin{document}
    \begin{tikzpicture}
        % picture code goes here
    \end{tikzpicture}
\end{document}
To draw a line, say from (0,0) to (1,1), use
\draw (0,0) -- (1,1);Note the semi-colon at the end of the line – TikZ gets quite upset if you miss this out.
If you put this command where it says % picture code goes here above and compile this, you should be looking at a line like this:

As well as lines, you can draw nodes, which is how I’m going to draw the circles (it’s not the only way). A node is placed at a coordinate and must contain some text in {}, even if this is blank (as it is here because I don’t want text in my circles).
So to draw a basic node at (1,0):
\node at (1,0) {};By default, a node is an invisible square. To make it a visible circle, I’d use
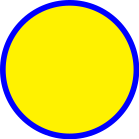
\node[draw,circle] at (1,0) {};Here I want coloured circles. To draw a circle with a blue border and a yellow inside, use
\node[draw=blue,fill=yellow,circle] at (1,0) {};If you run this line, you should see something like this:
Here I want to define my own colours, for which I will use \usepackage{xcolor}. You can define colours in various ways, for example here I use RGB (red, green, blue) values to define the colour for the inside of the tan circles:
\definecolor{tan}{rgb}{0.702,0.541,0.329}Lines and coloured circles is all that’s needed for this image, so you might like to have a go at this point at reproducing the cover graphic. I used a couple of other TikZ and LaTeX tricks, though, to simplify the code (depending on what you consider simple!).
First, to avoid repetitive code, I used some for loops. For example, this code is used to draw my grid:
\foreach \i in {0,...,6}{
    \draw (\i,0) -- (\i,6);
    \draw (0,\i) -- (6,\i);
}
Hopefully this is fairly self-explanatory – the variable \i takes the values in 0,...,6 in turn and the loop runs the two \draw commands. You can nest loops inside other loops.
I also use a command called scope with shift to move things around the image. For example, I use scope to move the grid half a unit left and down using the code below, so that I can use (0,0) in my grid code and also put a circle at (0,0). This is just a way of avoiding having to put a lot of -0.5s in my code.
\begin{scope}[shift={(-0.5,-0.5)}]
    % image to be shifted
\end{scope}
The last thing I do is a bit of LaTeX trickery, which isn’t necessary but again condenses the code. Rather than draw each of my circles one at a time, I wrote a command \drawblock to which I pass two coordinates \i and \j, which each range over {0,1,2}. My command does this:
- Works out
\i+\jand determines which colour to make the circle:- if the coordinates sum to 2, it’s tan;
- if the coordinates sum to 0 or 3, it’s red;
- otherwise (1 or 4), it’s blue.
- Draws four circles in a little grid and then shifts this to the right point in the image (scaled because the grid is actually 6 squares rather than 3).
Here’s the result. The full code I ran to produce this is available via GitHub.