With the emphasis on occasionally, I’m occasionally working to (sort of) recreate Martin Gardner’s cover images from Scientific American, the so-called Gardner’s Dozen.
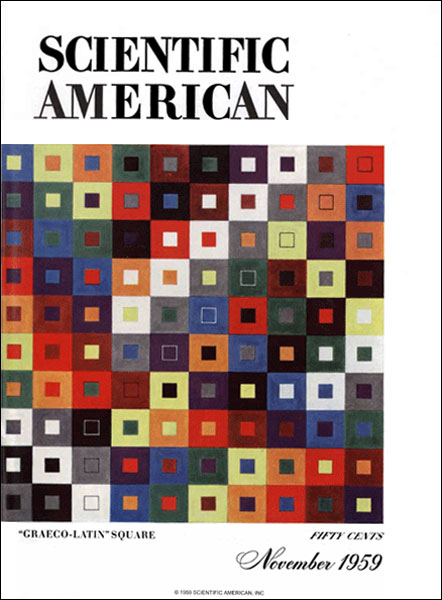
This time I’m looking at the cover image from the November 1959 issue. The column is ‘How three modern mathematicians disproved a celebrated conjecture of Leonhard Euler’, about the so-called Euler’s Spoilers, the story of three mathematicians – Parker, Bose and Shrikhande – who had disproved a conjecture of Euler’s about Latin squares. The column was reprinted as chapter 14 in his New Mathematical Diversions from Scientific American.
Orthogonal Latin squares, also known as Graeco-Latin squares, are really a pair of overlapping Latin squares – traditionally one in Latin letters and the other in Greek – with the additional property that every possible pair of one Latin and one Greek letter appears exactly once.
Here’s a 3 by 3 orthogonal Latin square in Latin letters A, B, C and Greek letters α, β, γ. Notice how each of the Latin letters appears exactly once on each row and column, and the same is true of the Greek letters, and that every Latin letter is paired with every Greek letter exactly once.
| Aβ | Bα | Cγ |
| Cα | Aγ | Bβ |
| Bγ | Cβ | Aα |
Euler had conjectured that no orthogonal Latin squares of order \(4k+2\) exist, on the basis that he couldn’t make one either 2 by 2 or 6 by 6. In fact, squares exist for all \(n>1\) except \(n=2\) and \(n=6\).
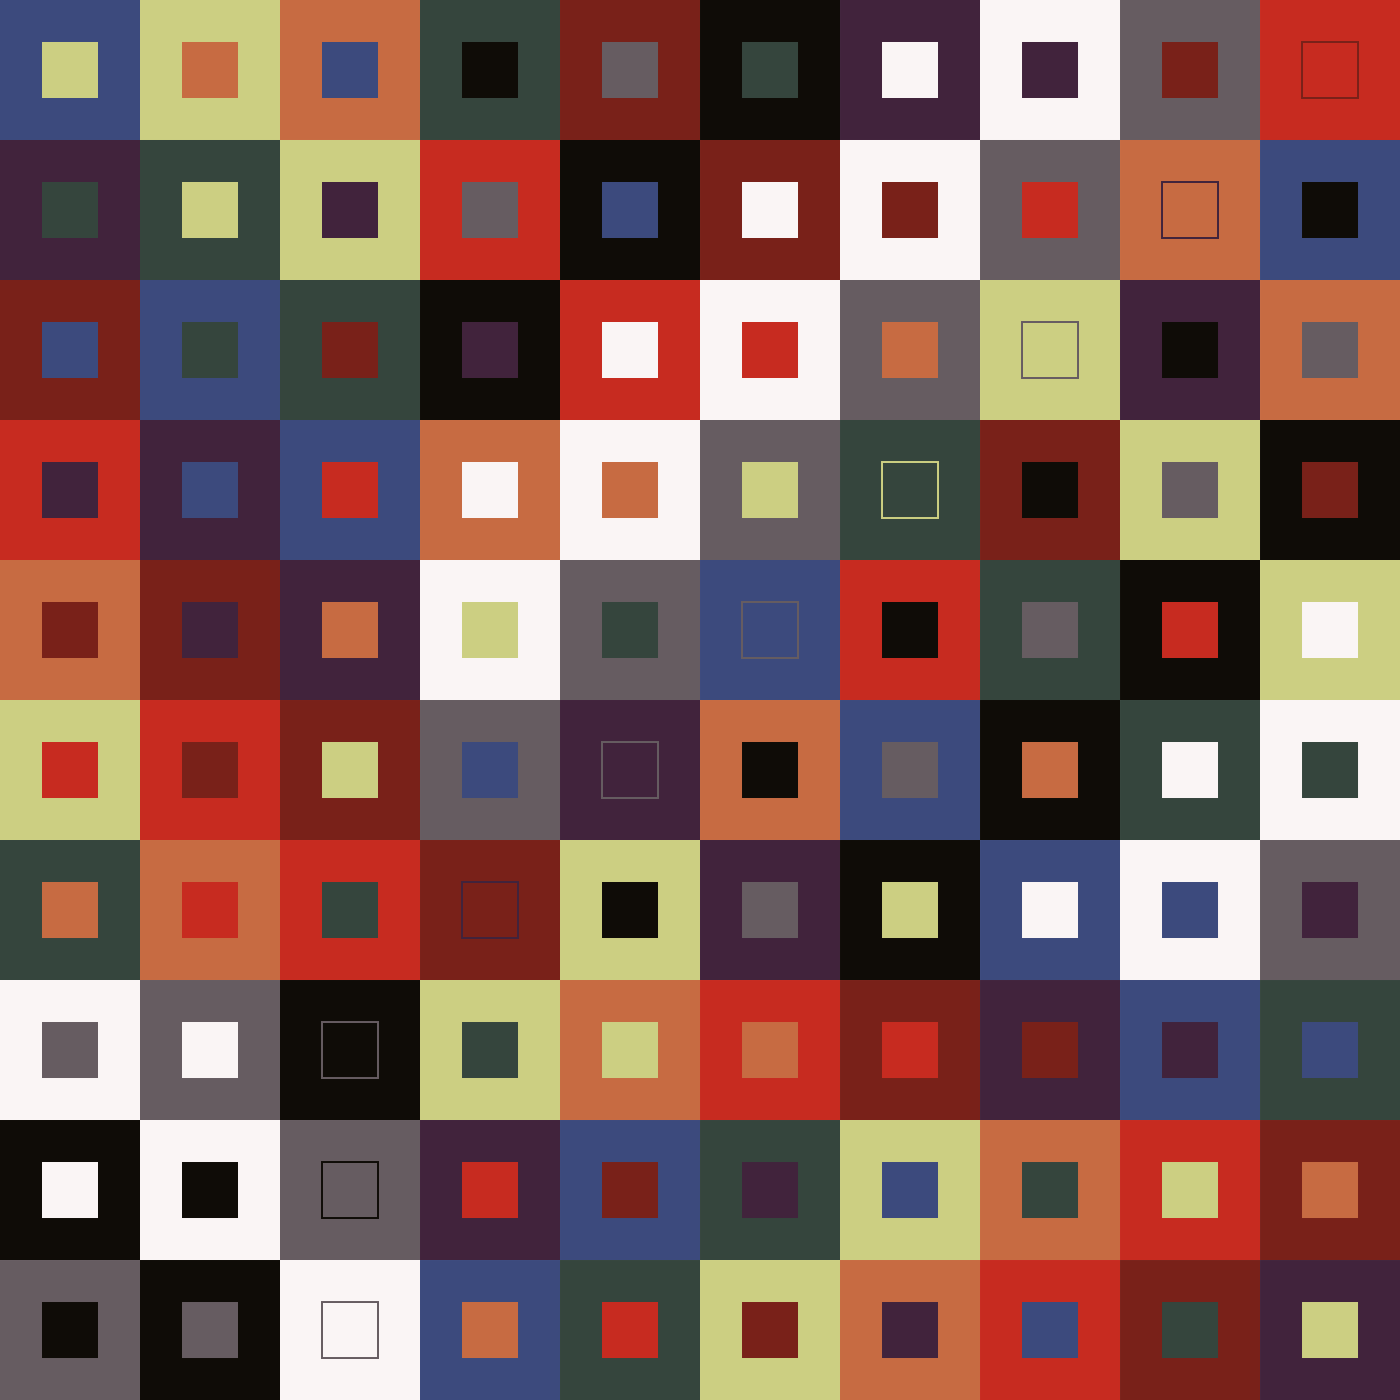
The cover image is a 10 by 10 orthogonal Latin square. Since \(k=2\) gives \(4k+2=10\), this is a magazine cover counterexample of Euler’s conjecture.
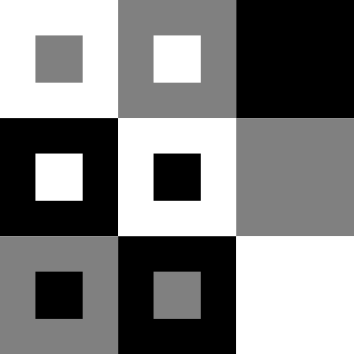
Notice how in the cover image at the bottom left there is a 3 by 3 sub-square that forms a self-contained 3 by 3 orthogonal Latin square in three colours? In this post, I’ll focus on drawing this small sub-square, to keep things simple.
Using the Graeco-Latin square above, we can associate the squares with letters like this:
- A: big white square;
- B: big grey square;
- C: big black square;
- α: small white square;
- β: small grey square;
- γ: small black square.
In TikZ, we can draw a rectangle easily enough. This code will draw a rectangle from (0,0) to (1,1) with no border (draw=none) and filled grey (using the American spelling). Put it inside a \begin{tikzpicture} environment, and don’t forget to \usepackage{tikz} in the document header.
\draw[draw=none,fill=gray] (0,0) rectangle (1,1);We can layer TikZ graphics on top of each other, so to make a small rectangle inside a larger one we can just draw the big one then draw the small one on top, like this.
\draw[draw=none,fill=gray] (0,0) rectangle (1,1);
\draw[draw=none,fill=white] (0.3,0.3) rectangle (0.7,0.7);
This looks like this:

We can position this on the image either by changing the values of the coordinates or by using an environment called scope, which has the advantage that you don’t have to work out the 0.3 and 0.7 versions of every square. Here’s the scope approach, shifting the code above so it draws a square with bottom left corner at coordinates (5,5).
\begin{scope}[shift={(5,5)}]
    \draw[draw=none,fill=gray] (0,0) rectangle (1,1);
    \draw[draw=none,fill=white] (0.3,0.3) rectangle (0.7,0.7);
\end{scope}
Of course, I could now go through and draw a lot of squares by copying and pasting lots of copies of this code which I edit for position and colour, but I prefer to do this with a for loop. For loops in TikZ have the nice property that you could loop over several variables at the same time. For example, this loop draws three squares in a row – at coordinates (0,0), (1,0) and (2,0).
\foreach \i/\j in {0/0,1/0,2/0}{
    \begin{scope}[shift={(\i,\j)}]
        \draw[draw=none,fill=gray] (0,0) rectangle (1,1);
        \draw[draw=none,fill=white] (0.3,0.3) rectangle (0.7,0.7);
    \end{scope}
}
Here we don’t want to draw the same colours each time. We can pass the colours as loop variables also. Now we are looping over four variables, \i, \j, \outer and \inner, all drawn from a list of values.
\foreach \i/\j/\outer/\inner in {0/0/white/gray,1/0/gray/white,2/0/black/black}{
    \begin{scope}[shift={(\i,\j)}]
        \draw[draw=none,fill=\outer] (0,0) rectangle (1,1);
        \draw[draw=none,fill=\inner] (0.3,0.3) rectangle (0.7,0.7);
    \end{scope}
}
We can feed this a full list of coordinates and colours and get a 3 by 3 orthogonal Latin square as desired.
One problem you might notice with this is that in the Scientific American cover image when the inner and outer colours are the same, the inner square is given a little border, and we haven’t done that. We’ll deal with that later.
First I want to deal with a problem that won’t affect the overall look of the image and might just be me: I got pretty bored already of typing all the coordinates, and I’m conscious I’m very likely to get something wrong. I think it would be better to give it a list of pairs of colours and have the program arrange it into a grid for me. This makes the coding more complicated, though, so your preference might be to do the extra typing.
To do it my way, I’m going to define \i and \j outside of the loop and update them myself rather than letting \foreach do it. The ‘pgf’ in these commands refers to the fact that we are programming in PGF, which underpins TikZ. \pgfmathsetmacro is similar to LaTeX’s \newcommand only with extra mathematical functionality.
\pgfmathsetmacro{\i}{0};
\pgfmathsetmacro{\j}{0};
We can increment \i using this command. The ‘truncate’ here means we are turning the output into an integer, whereas the result of a calculation naturally wants to be a float (e.g. 1.0).
\pgfmathtruncatemacro{\i}{\i+1};There is a little niggle here. When you use \pgfmathtruncatemacro inside a loop, it acts on a local variable that only changes for this iteration of the loop. One way to deal with this is by passing a parameter remember to the \foreach command, which tells it to pull the value from the previous iteration.
Putting that together, we now have some code that will draw our squares in a single row.
\pgfmathsetmacro{\i}{0};
\pgfmathsetmacro{\j}{0};
\foreach[remember=\i as \i,remember=\j as \j] \outer/\inner in {white/gray,gray/white,black/black,black/white,white/black,gray/gray,gray/black,black/gray,white/white}{
    \begin{scope}[shift={(\i,\j)}]
        \draw[draw=none,fill=\outer] (0,0) rectangle (1,1);
        \draw[draw=none,fill=\inner] (0.3,0.3) rectangle (0.7,0.7);
    \end{scope}
    \pgfmathtruncatemacro{\i}{\i+1};
}
That isn’t quite what we wanted!

When \i gets big enough that we reach the end of the row, we want to do two things:
- reset
\ito zero, like a carriage return on an old-fashioned typewriter; - decrease
\jby one, like a line feed (reading the square from top to bottom).
To do this I’m going to use a TeX if statement. These are a bit clunky, and there are more sophisticated ways, but here this will do what we need. The format is like this:
\if\a\b
    % do something
\else
    % something else
\fi
This tests whether \a equals \b and takes the first action if it does and the second if not, and the \fi closes the statement.
We are counting from \i=0, so want the line to reset when \i=2. We test this using \if\i2.
\pgfmathsetmacro{\i}{0};
\pgfmathsetmacro{\j}{0};
\foreach[remember=\i as \i,remember=\j as \j] \outer/\inner in {white/gray,gray/white,black/black,black/white,white/black,gray/gray,gray/black,black/gray,white/white}{
    \begin{scope}[shift={(\i,\j)}]
        \draw[draw=none,fill=\outer] (0,0) rectangle (1,1);
        \draw[draw=none,fill=\inner] (0.3,0.3) rectangle (0.7,0.7);
    \end{scope}
    \if\i2
        \pgfmathtruncatemacro{\i}{0}; % CR
        \pgfmathtruncatemacro{\j}{\j-1}; % LF
    \else
        \pgfmathtruncatemacro{\i}{\i+1};
    \fi
}
Now we are back to the 3 by 3 grid with all the right colours, except the inner squares are missing their borders. In the original image, the inner squares only have borders when the inner and outer colours match, and the border colour isn’t the same for each colour. This means the code to deal with this is going to have to be complicated if statement.
Without getting more complicated, basic if statements in TeX work better on numbers than strings, so first I’m going to convert my colours to numbers. Actually this will help me write out the square since it means an orthogonal Latin square something like this, where the number on the left is the Latin letter/big square and the number on the right is the Greek letter/small square.
| 0/1 | 1/0 | 2/2 |
| 2/0 | 0/2 | 1/1 |
| 1/2 | 2/1 | 0/0 |
Here I define my colours using the xcolor package, calling them 0, 1 and 2. Do this in the header before \begin{document}.
\usepackage{xcolor}
\definecolor{0}{rgb}{0.98, 0.96, 0.96} % white
\definecolor{1}{rgb}{0.40, 0.36, 0.38} % grey
\definecolor{2}{rgb}{0.06, 0.05, 0.03} % black
For the if statement, I’m going to create a new command in the header of my LaTeX document (outside the TikZ environment) that takes in the current colour and returns a sensible border. In this case, if the value of the input (#1) is grey (1) then we return black (2), and otherwise we return grey (1).
\newcommand{\innerline}[1]{\if#112\else1\fi}Now we need an if statement inside our loop to detect when the inner and outer colours match. If they do, instead of draw=none to produce no border, the inner square needs to call our new command \innerline. Putting all that together, here’s the full example.
\documentclass{standalone}
\usepackage{tikz}
\usepackage{xcolor}

\newcommand{\innerline}[1]{\if#112\else1\fi}

\definecolor{0}{rgb}{0.98, 0.96, 0.96} % white
\definecolor{1}{rgb}{0.40, 0.36, 0.38} % grey
\definecolor{2}{rgb}{0.06, 0.05, 0.03} % black

\begin{document}
    \begin{tikzpicture}
        \pgfmathsetmacro{\i}{0};
        \pgfmathsetmacro{\j}{0};
        \foreach[remember=\i as \i,remember=\j as \j] \outer/\inner in {0/1,1/0,2/2,2/0,0/2,1/1,1/2,2/1,0/0}{
            \begin{scope}[shift={(\i,\j)}]
                \draw[draw=none,fill=\outer] (0,0) rectangle (1,1);
                \if\outer\inner
                    \draw[draw=\innerline{\inner},fill=\inner] (0.3,0.3) rectangle (0.7,0.7);
                \else
                    \draw[draw=none,fill=\inner] (0.3,0.3) rectangle (0.7,0.7);
                \fi
            \end{scope}
            \if\i2
                \pgfmathtruncatemacro{\i}{0}; % CR
                \pgfmathtruncatemacro{\j}{\j-1}; % LF
            \else
                \pgfmathtruncatemacro{\i}{\i+1};
            \fi
        }
    \end{tikzpicture}
\end{document}
And the output:
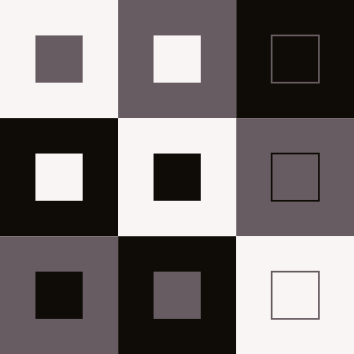
The full version is a bit more complicated, but follows the same basic principle. It defines nine colours, so has a more complicated command for choosing the inner border colour, and of course uses a longer list of colour pairs in the for loop. It also does the carriage return and line feed later, when \i=9.
Here’s the result, a Latin square Euler thought wasn’t possible.