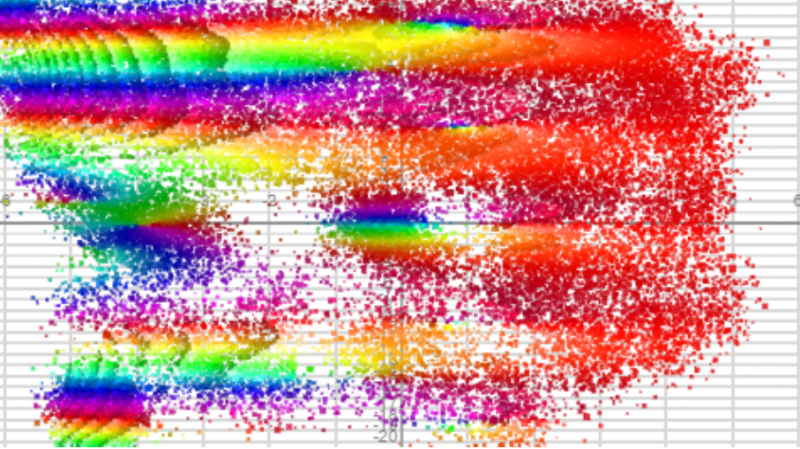
Christian’s put together this fun applet for exploring the Zeta function – you can move your pointer around to reveal the value of $\zeta$ at each point in the complex plane.
The hue (colour) revealed is the argument of the value, and the lightness (bright to dark) represents the magnitude. There’s a blog post over at Gandhi Viswanathan’s Blog explaining how it works.
The resulting plot has contour lines showing how the function behaves.

