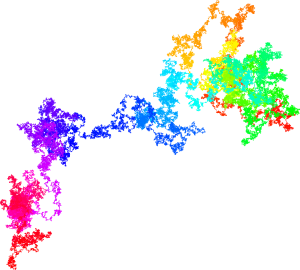
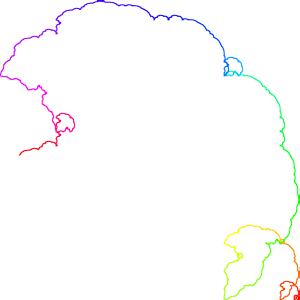
Something that whipped round Twitter over the weekend is an early version of a paper by Francisco Aragón Artacho, David Bailey, Jonathan Borwein and Peter Borwein, investigating the usefulness of planar walks on the digits of real numbers as a way of measuring their randomness.

A million step walk on the concatenation of the base 10 digits of the prime numbers, converted to base 4
A problem with real numbers is to decide whether their digits (in whatever base) are “random” or not. As always, a strict definition of randomness is up to either the individual or the enlightened metaphysicist, but one definition of randomness is normality – every finite string of digits occurs with uniform asymptotic frequency in the decimal (or octal or whatever) representation of the number. Not many results on this subject exist, so people try visual tools to see what randomness looks like, comparing potentially normal numbers like $\pi$ with pseudorandom and non-random numbers. In fact, the (very old) question of whether $\pi$ is normal was one of the main motivators for this study.
The authors decided to see if representing numbers as walks on the plane would lead to more useful definitions of randomness, or easier ways of spotting non-normal numbers, than other methods. They point out that the matrix method (fill up a matrix with the digits of the number, left-to-right and top-to-bottom) is a rough-and-ready visual guide to randomness, but doesn’t yield quantitative measures and sometimes gives false-positives.
Representing numbers as walks on a plane is an idea that has been around for a while, (one example here by Andrew Collins) but this paper goes a lot further than anything I’ve seen before.
The paper constitutes a mix of experimental maths based on computation with ridiculously large numbers of digits from numbers like $\pi$, and some rigorous proofs.
Three quantitative measures of randomness that they investigated were the expected distance from the origin of a point on the walk, the number of unique points visited, and the fractal dimension of the walk (strictly speaking, the Minkowski-Bouligand “box-counting” dimension). These can be seen in the visual representation of a walk, but are also well-defined numerical measures.
The authors prove normality for a fairly contrived class of Champernowne-ish numbers, and discuss a variety of other methods for representing numbers visually, which sometimes make non-normality obvious.
The paper is crammed with loads of interesting little things for the spectator, even if you’re not following along with the main investigation. The fraction which writes out a blackboard-bold $\mathbb{Q}$ is wonderful, and the appendix serves as a nice short list of interesting real numbers, including the Champernowne constant and the paper-folding constant. Francisco Artacho has created an enormous picture from the first 100 billion digits of $\pi$, which is included in the paper but which you can see in full detail at GigaPan.
We could have reported this as “Mathematicians stumble towards solution of centuries-old sacred number mystery”, but we’re not the Daily Mail, thank God.
Source: Steven Strogatz on Twitter (and countless others)
Paper: Tools for visualizing real numbers: Planar number walks
Mind-blowing imagery: 108 gigapixel image of a walk on the first 100 billion digits of $\pi$
According to Jonathan Borwein’s CV page, the paper has been submitted to the Mathematical Intelligencer so should appear there at some point, after peer-review.
(Images © Francisco Aragón Artacho, reproduced with kind permission)

I love the idea of maths dating – “Looking for my Mr. Equal To The Sum Of His Factors”.