Phil Harvey gave a talk on this subject at last November’s MathsJam conference. We liked it so much, we asked him if we could put it on the site. Phil’s kindly written his talk up as an essay for us.
I am 64¼ years old and I’ve been a maths teacher all my working life. In that time things have changed. Long gone are the days when gowned masters would sweep in, silence any murmur with half a raised eyebrow, and delight compliant uniformed schoolchildren with chalk-covered boards of mathematical exposition.
No, you’re right. That never happened outside the covers of Goodbye Mr Chips, even in my day.
The reality then. Schoolchildren have morphed into learners. Exam results rule. Quality (in the sense that Orwell might have used the word) is managed by quality managers. And so our working lives are driven by the pursuit of Ofsted targets, success rates, achievement rates, benchmarks, observation grades, results. And every joyless lesson has its own lesson plan, with aims, objectives, learning outcomes and action points. But above all, those damned results – and every year, year after year, they had to IMPROVE.
Well I was no good at any of this stuff – and consequently I always got on very badly with my managers. Until one year…
AS Maths results
It had been my job to produce an annual report on the progress or otherwise of the maths department at my college, and to give a presentation on this to management. In 2007 I prepared my stats for AS “high grades” (that is, grades A or B). The table below shows the percentages achieving high grades in 2007, and 2006 for comparison.
20072006
| AS Maths | 18 | 57 | 31.6% | 12 | 34 | 35.2% |
|---|
Quite clearly I’m in trouble. The results have failed to IMPROVE. And I know it will not help my defence if I appeal to sporadic fluctuation or regression to the mean. Or even tell the truth – that is, that in 2007 we had a not so good group of students (sorry, learners).
Then I had a great idea. I would split the group into those who had taken a Mechanics module, and those who’d taken a Statistics module as part of their AS Maths. What happened was absolutely amazing!
Here is the revised version.
20072006
| AS Maths | 18 | 57 | 31.6% | 12 | 34 | 35.2% |
|---|---|---|---|---|---|---|
| AS Mechanics | 5 | 9 | 55.6% | 6 | 11 | 54.5% |
| AS Statistics | 13 | 48 | 27.1% | 6 | 23 | 26.1% |
Both the split groups IMPROVE.
I’m happy. Management’s happy. Everyone’s a winner.
This was my eureka moment. But it set me thinking.
What if splitting the group in this way hadn’t worked to my advantage? Could I have got the favourable outcome I wanted by choosing different “splitting criteria”. For example – gender, those who wear glasses and those who don’t, those who watch Strictly Come Dancing and… (you get the idea!).
Batting averages
Four years later I came upon another weird thing. I was trying to decide which of two Leicestershire county cricketers, Jigar Naik or Tom New, was the better batsman. (Why? Don’t ask!)
Here are their batting averages for 2010 and 2011.
| 2010 | 2011 | |||||
|---|---|---|---|---|---|---|
| Runs | Outs | Batting Average | Runs | Outs | Batting Average | |
Jigar Naik |
301 | 9 | 33.4 | 545 | 25 | 21.8 |
Tom New |
746 | 23 | 32.4 | 412 | 19 | 21.7 |
Clearly it’s close, but Jigar Naik consistently seems to have the edge both seasons. Based on this evidence, the better batsman is undeniably Jigar Naik. No one would disagree with that.
No one – except possibly Tom New. He might argue that it would have been fairer to combine the data for the two years. And that when you do this, the apparently obvious conclusion is turned completely on its head.
| 2010 and 2011 combined | |||
|---|---|---|---|
| Runs | Outs | Batting Average | |
Jigar Naik |
846 | 34 | 24.9 |
Tom New |
1158 | 42 | 27.6 |
Simpson’s Paradox
Both these wondrous anomalies are manifestations of Simpson’s Paradox. Surely this has to be the greatest gift ever to practitioners of the dark art of statistical conjuring.
How it works is like this.
All we do is find integers $a, b, c, d, p, q, r, s$ such that
$\displaystyle{\frac{a}{b} \gt \frac{p}{q}}$ and $\displaystyle{\frac{c}{d} \gt \frac{r}{s}}$ but $\displaystyle{\frac{a+c}{b+d} \lt \frac{p+r}{q+s}}$.
To go back to the two examples, you can see that Simpson’s Paradox “works” in both cases if you convert the percentages back into fractions.
AS results:
$\displaystyle{ \frac{18}{57} \lt \frac{12}{34} }$ but $\displaystyle{ \frac{5}{9} \gt \frac{6}{11} }$ and $\displaystyle{ \frac{13}{48} \gt \frac{6}{23} }$.
Batting averages:
$\displaystyle{ \frac{301}{9} \gt \frac{746}{23} }$ and $\displaystyle{ \frac{545}{25} \gt \frac{412}{19} }$ but $\displaystyle{ \frac{846}{34} \lt \frac{1158}{42} }$.
A simple example, represented graphically
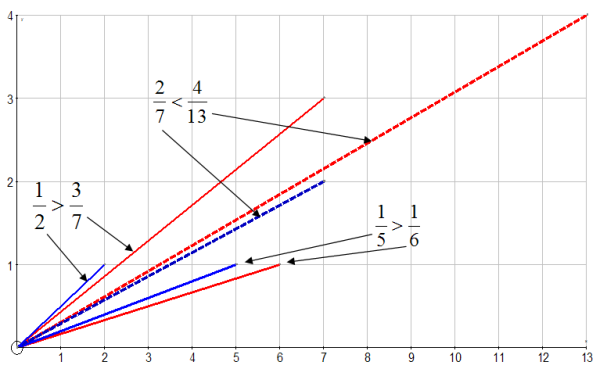
The simplest example is
$\displaystyle{ \frac{1}{2} \gt \frac{3}{7} }$ and $\displaystyle{ \frac{1}{5} \gt \frac{1}{6} }$ but $\displaystyle{ \frac{2}{7} \lt \frac{4}{13} }$,
and I’ll use this example to illustrate Simpson’s Paradox in a nice graphical way.
Take each fraction $\frac{a}{b}$ to be the gradient of the line from the origin to the point $(b,a)$. Then the $\frac{2}{7}$ line is a vector with components $\frac{1}{5}$ and $\frac{1}{2}$, and similarly the $\frac{4}{13}$ vector has components $\frac{3}{7}$ and $\frac{1}{6}$.
So the sketch below shows that the ordering of the gradients of the resultant vectors is reversed by the ordering of the gradients of the corresponding component vectors.
Can you make Simpson’s Paradox happen? And if so, how?
Thinking about the AS Maths Results example, a couple of questions come to mind.
“Can I always find a way of splitting the teaching group into smaller groups such that the original conclusion is reversed?” (The criterion for assigning the smaller groups can of course be decided afterwards!)
and
“If I can’t always do this, then under what conditions can I? and how?”
I would love to know the answers to these questions.
Case studies
A wonderfully entertaining case study is to be found on Alan Crowe’s blog.
I’m only sad that it isn’t true!
But there are many well-documented instances of Simpson’s Paradox that have found their way into academic publications.
1975 – Sex Bias in Graduate Admissions: Data from Berkeley, P.J. Bickel, E.A. Hammel, J.W. O’Connell.
1986 – Success rates of two treatments for kidney stones, C.R. Charig, D.R. Webb, S.R. Payne, J.E. Wickham.
2004 – Baseball batting averages, Ken Ross.
2006 – Low birth rate for mothers who smoke, Allen J. Wilcox.
A bit of background
Edward H. Simpson had been a codebreaker at Bletchley Park during the Second World War. The phenomenon that bears his name has been widely known since the publication in 1951 of the paper The Interpretation of Interaction in Contingency Tables. But Karl Pearson (of χ-squared and correlation coefficient fame) had written in 1899 about the paradox in a paper entitled Genetic (reproductive) selection: Inheritance of fertility in men.
Two questions
But at the end of it all, what I really want to know is…
“Who was the better batsman?”
and
“Did my AS Maths results improve?”
Sources
Impossible? Surprising solutions to counterintuitive conundrums by Julian Havil (Princeton University Press)
Wikipedia
“Can I always find a way of splitting the teaching group into smaller groups such that the original conclusion is reversed?”
“If I can’t always do this, then under what conditions can I? and how?”
The solutions to these questions are quite disturbing. I haven’t done a rigourous analysis but my back of the envelope reasoning is mostly confirmed by a colleague friend. As long as you have enough students and enough variation, you can find such a profitable split of students.
To explain that consider two cricketers. If one cricketer hit 50 runs and got out every single game over two seasons and another cricketer scored 40 and then got out every game (or if there was only tiny variations around these figures), there is no way to push that data around.
However, if you can find one small group who have succeeded greatly (like mechanic students in 2007 above with 55%>>31%) and this group (or a fudged analogous group) made up a larger proportion the year before (only ~1/6 in 2007 but ~1/3 in 2006) then you are pretty much guaranteed to be able to pull this off. (I think. This is rough reasoning.)
An example on wikipedia [ http://en.wikipedia.org/wiki/File:Public_Domain_Simpson%27s_Paradox.gif ] uses a different criteria (sort of a reverse criteria since they look at the problem from the other direction). In measuring successful applicants by gender to two scholarships, they have a larger subgroup (of boys) apply for the hard to get scholarship. Even though the boys still beat the girls in this category, the large amount of boys who failed here will throw off the overall boys vs girls results in favour of girls.
Tom New does well because he played many more games than Jigar Naik in the year that they both did well while they are much closer the following year.
So, in short, look for a group which bucks the trend by a lot in both size and success in just one of the years/categories and you can likely manufacture a Simpson’s paradox effect. When trying to fudge it, a large number of data with higher variation will help this greatly while a small number of data with very little variation will make it quite difficult.