I have a new toy. ‘Ox Blocks’ box promises “Noughts and Crosses with a novel twist”.
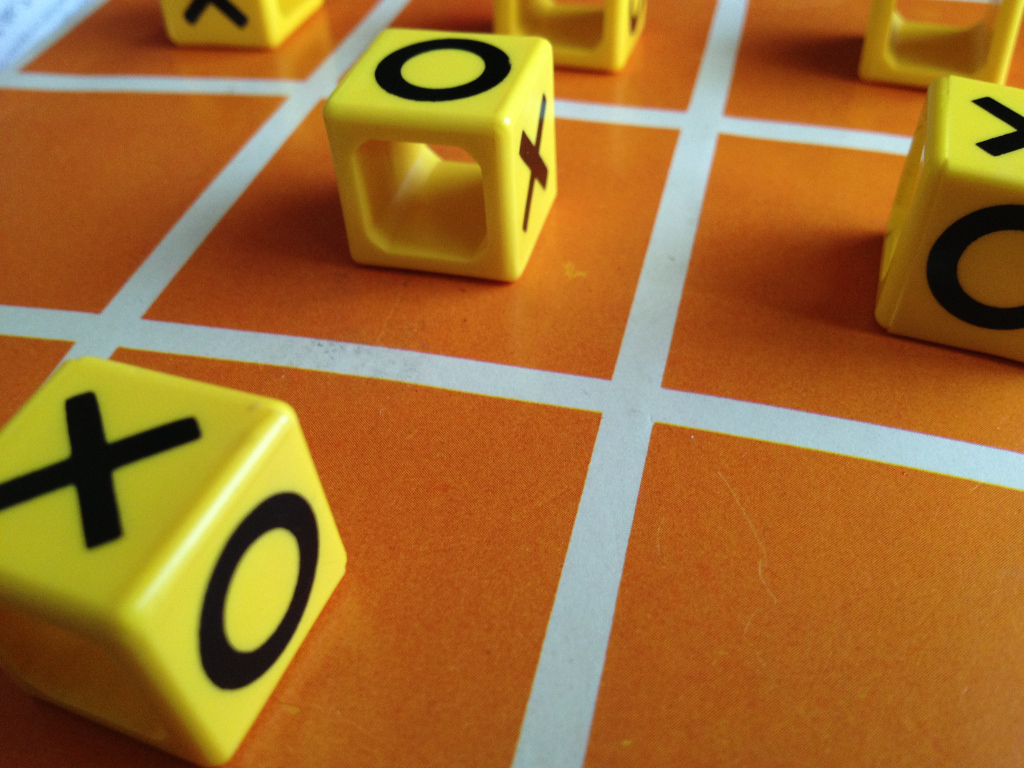
I have a new toy. ‘Ox Blocks’ box promises “Noughts and Crosses with a novel twist”.
Those of you with long, long memories (and who attend a MathsJam) may recall that back in November 2012, MathsJam HQ sent out a questionnaire to monthly regional meetups, with various questions about attendance and ping-pong balls. The purpose of the survey was to get a snapshot of what the monthly MathsJams are like, as well as to produce some spurious graphs. Christian and I, who run the Newcastle and Manchester MathsJams respectively, were tasked with analysing the data. Here are our findings!
Better late than never, I’ve posted my recap of Newcastle MathsJam’s March and April meetings on my mathem-o-blog. We talked about topology, made a tiny blanket for a baby snake, failed to work a cardboard computer, and a lot more.
The Online Encyclopedia of Integer Sequences contains over 200,000 sequences. It contains classics, curios, thousands of derivatives entered purely for completeness’s sake, short sequences whose completion would be a huge mathematical achievement, and some entries which are just downright silly.
For a lark, David and I have decided to review some of the Encyclopedia’s sequences. We’ll be rating sequences on four axes: Novelty, Aesthetics, Explicability and Completeness.
A225143
Primes from merging of 10 successive digits in decimal expansion of $\zeta(2)$ or $\frac{\pi^2}{6}$.9499012067, 4990120679, 3040043189, 1896233719, 2337190679, 9628724687, 2510068721, 8721400547, 9681155879, 5587948903, 7564558769, 9632356367, 3235636709, 3200805163, 4445184059, 3876314227, 2276587939, 1979084773, 9420451591, 9120818099, ...
This is the third in a series of posts about the maths of Star Trek. Part I covered the probability of survival while wearing a red shirt, and Part II discussed the mathematics of alien biology.
You may have seen an article linked to last week, written by Jordan Weissmann at The Atlantic. The article was titled ‘Here’s How Little Math Americans Actually Use At Work‘, although mysteriously this journalist makes use of some mathematical analysis of survey data, and not only that, the data appears to show that 94% of Americans claim to use mathematics as part of their daily job.
The article discusses people’s misconceptions about the future utility of what they were learning, as well as the divide between using ‘any math’ and ‘advanced math’, which includes calculus, algebra and statistics. The number of Americans who admitted to using this type of maths appears to drop off once you get to anything more complicated than fractions, and also presented is an analysis of this divide by job type.
A very well-written and thoughtful response to this has already been posted at mathematics professor Bret Benesh’s blog, which gives four reasons why the article annoyed him (and probably several other people too).
Since we’d like to write a funny post about it, if you’ve been sent any literature for the upcoming local elections in the UK (or indeed, from the past or from other elections around the world) which contains a graph or chart of questionable rigor, we want to know about it.
As an example, Colin Beveridge sent us this classic from his doormat:
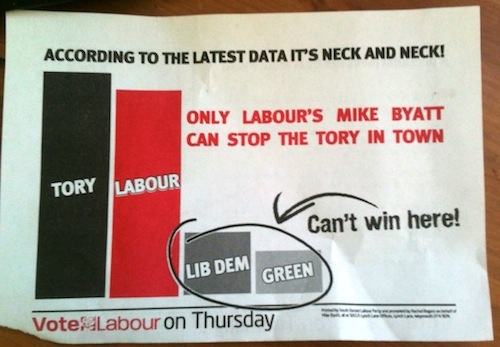
We’ll be awarding bonus points for inaccurate pie charts, exaggerated/meaningless bar sizes, the complete absence of axis label or scale, the use of ‘Can’t win here!’ and any other sneaky/incompetent features. Email your submissions to root@aperiodical.com, and watch out for a roundup post if we collect a sizeable pile.