Anna Haensch and Annie Rorem are the hosts of a new podcast, The Other Half. This is the second of two posts based on the first episode, about racism and segregation.
In the first part of episode one, we use the Racial Dot Map to get a sense of what race looks like in our country. And while it certainly gives us a picture of the stark racial lines segregating in our communities, it doesn’t necessarily help us understand how we got to be this way, and perhaps
more relevant, how we can fix this. In the second part of episode one we look at Parable of the Polygons, a playable blog post by Vi Hart and Nicky Case, to help us understand these slightly more nuanced questions.
Based on a paper by Nobel Prize-winning game theorist, Thomas Schelling, the playable post combines text and interactive games to show how racism shapes our communities. Schelling’s paper asserts, and the post allows you to see for yourself, that each individual’s threshold for racial tolerance needn’t be all that low to result in extreme community segregation. In Schelling’s model, he assumes that people are reasonably tolerant: They will only move from their neighborhoods if less that ⅓ of their neighbors look like them.
That means that if I live on a city block, where I have eight neighbors, I’ll happily stay put as long as at least three of my neighbors look like me. In other words, potentially five of my neighbors look different from me. Seems like a reasonable thing, right?
But, as Schelling proves, the results are quite counterintuitive: This small bias is enough to result in completely segregated neighborhoods. Even for the most mathematically inclined, this can be a bit of a hard sell. Why the heck should this be true?
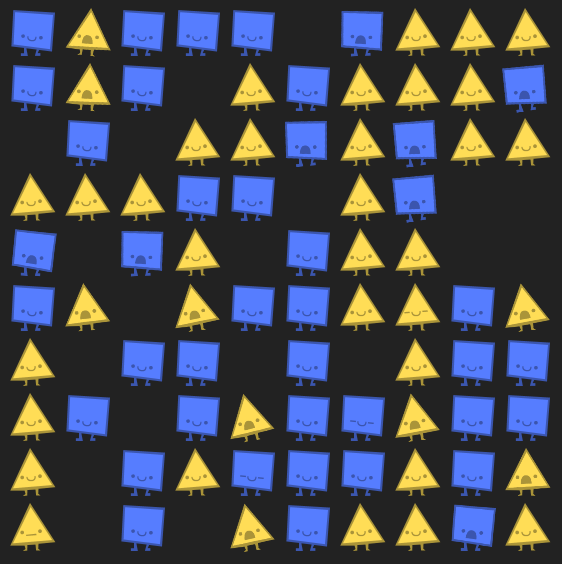
This is where Hart and Case’s post steps in. They help us understand this mathematical concept through a series of interactive drag-and-drop games. Rather than a neighborhood full of potentially racist people, they build a grid of “shapist” shapes: squares and triangles. Just like in Schelling’s paper, these “shapist” shapes will move if less than ⅓ of their neighboring shapes look like them. Clicking and dragging until every shape is smiling contentedly, you only needs to play a few rounds to convince yourself that total segregation is always the inevitable outcome.
In episode one we talk with creator Nicki Case about some of his motivations behind creating the post, and some of the broader implications that this has in our lives. Putting a quantitative measure on our own personal bias is a really helpful way to understand how our choices and actions affect the neighborhoods we live in.
The Other Half, a new podcast from ACMEScience.com, is an exploration of the the other half of a bunch of things. First, Anna and Annie want to take you on a tour of the other half of math — the fun half you might be missing when you learn math in school, the half that helps you makes sense of your own life. And on the flip side of that equation, they want to explore the other half of life — the half of day to day social scenarios that can be better understood by thinking about them like a mathematician. Lastly, Anna and Annie — as women of science — represent the other half of people. More than half of the humans on earth are female, but that parity isn’t reflected in the world of math and science. They hope to lend some much needed lady voices to the conversation. Listen in at theotherhalf.acmescience.com.