In this series of posts, we’ll be featuring mathematical video and streaming channels from all over the internet, by speaking to the creators of the channel and asking them about what they do.
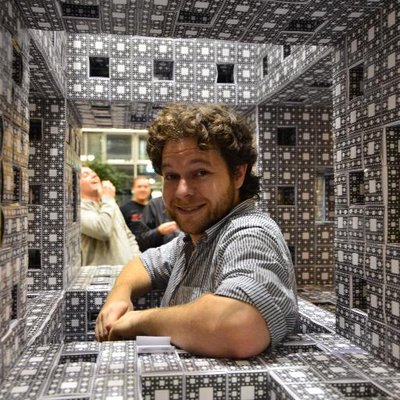
We spoke to Ben Sparks, the author of the SparksMaths YouTube channel, who shares recordings of live Geogebra builds illustrating various maths concepts.
Channel title: SparksMaths
Link: youtube.com/@SparksMaths
Topics covered: maths, music, education, and occasionally other stuff
Average video length: 20-30 mins, with some shorter
Recommended videos: Julia Sets and Orbits of Complex Iterations – Geogebra (Mandelbrot Build)
What is your channel about, and when/why did it start?
SparksMaths is a channel for me to chat about maths stuff myself, as opposed to the perhaps better known stuff I’ve done as a guest on the Numberphile channel. So far it’s mostly been focussed on how I build some of the interactive visualisations that I use in my work (and in Numberphile videos). Mostly using Geogebra, and occasionally Python and other tools.
Who are you? Tell us about yourself.
I am a maths teacher who has become a freelance maths communicator, also working with the Advanced Maths Support Programme, and the University of Bath, where I teach on the Communicating Maths 3rd year undergrad module.
Who is the intended audience for the channel?
Anyone interested in mathematics and maths teaching with dynamic visualisations, and those curious to see some live-builds – where you’ll see me get stuck, try to solve problems, and then polish up the results.
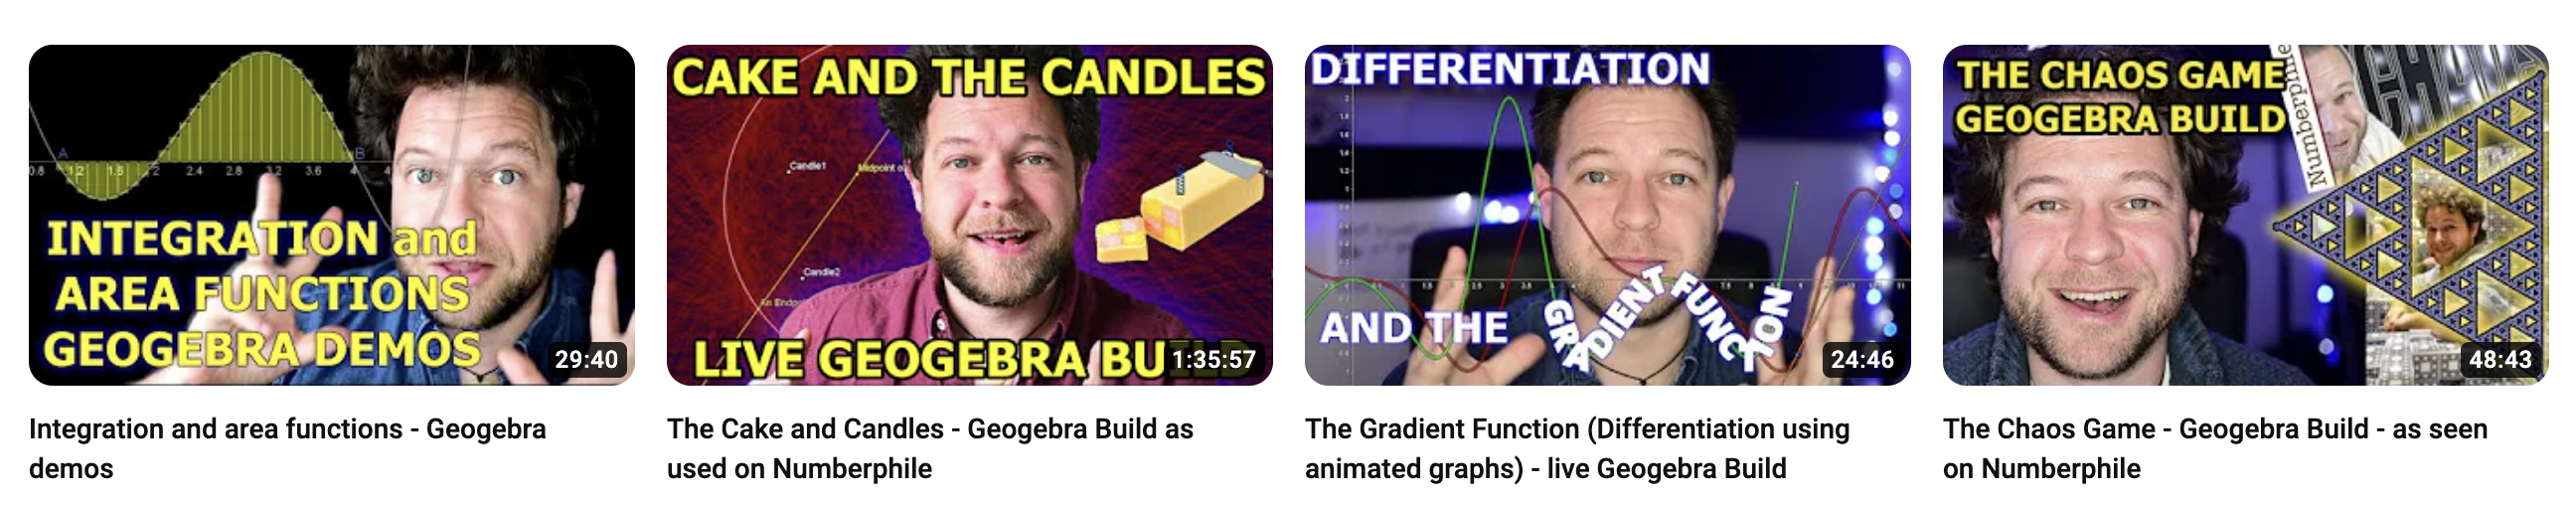
What is a typical video like?
The live-build videos usually start with a glimpse of a finished visualisation, before rewinding to a blank slate where I’ll start to build from scratch, and commentate as I go. Depending on the content I may go off on some mathematical tangents. I’ve also recently started trying to publish a series of YouTube shorts (<1 min videos) on basic tools I regularly use for this sort of thing.
Occasionally other styles of videos turn up (there’s some music, and some straight-up maths chat videos too).
Why should people watch? Why is it different to other mathematical video content?
This channel is different to my work on Numberphile since it’s not done in conversation with Brady, but rather straight to camera, and you’ll see a much more realistic portrayal of what it’s like to do maths and visualisation construction in real time – with all the mistakes and frustrations still visible.
I hope that the videos show a complete picture of how to build some nice visualisations, in a way that’s realistic enough for people to follow along if they wish. There will also be lots of little tips and tricks to pick up along the way.
What are some highlights of the channel so far?
Lots of people (>3.6M) have watched this Numberphile video on the Golden Ratio and sunflower spirals, and I explain how I build the visualisation in this video.