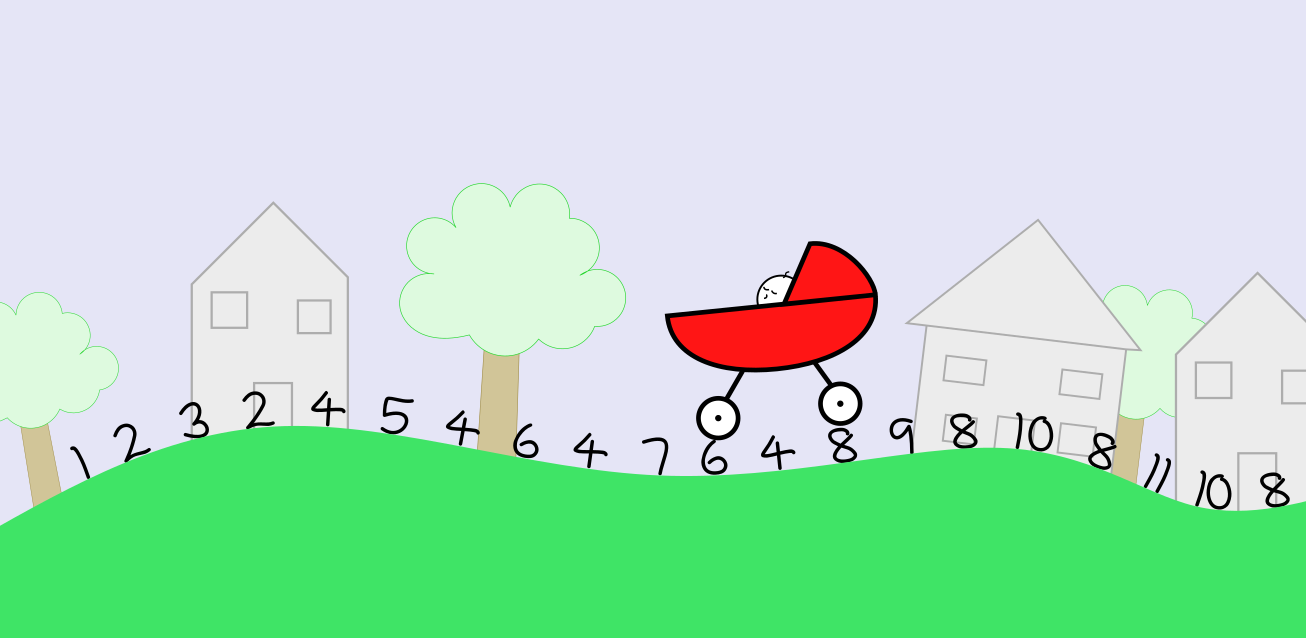
My son was born last September. While he doesn’t hate sleep as much as his sister did, he still needs a bit of help to drop off.
I’m not at all musically inclined, and I seem unable to remember more than a couple of lines from wordy songs (my version of “Papa’s gonna buy you a mockingbird” rapidly veers into nonsense as I try to think of a rhyme for the next line), so when the girl was little I hit upon the strategy of singing counting songs to lull her off to sleep.
Tweeting this because I want to do it but don't have time, and I want someone to pester me about it in a few weeks' time:
I'd like to start a collection of mathematical notation ambiguities, inconsistencies, and unpleasantness. It'd be a wiki, or at least collaboratively edited
— Christian Lawson-Perfect (@christianp) May 18, 2021
My aim is to collect examples of conventions in mathematical notation that lead to ambiguities, inconsistencies, or just make you feel yucky. This is largely a result of me wishing I had something to point to whenever I see $\sin^2$ or one of those viral “puzzles” relying on BODMAS.
My aim is to describe conventions, without prescribing a correct notation. Whenever I tweet a question about a notational convention, my aim is to find out the range of different opinions that people hold about it. I often get replies arguing authoritatively for a particular correct answer, usually followed up by an equally certain reply from someone else arguing for the opposite. Like all language, mathematical notation is just something we make up to help express our ideas, and opinions, abuses of notation, lapses in memory and convenience all work against consistency and clarity.
I’d like the site to collect all these difficult aspects of notation, so that they don’t trip up someone who thought they might have an easy day doing maths.
So, have a look, and if you can help to build it out, I’d be very happy!
Here’s a round-up of mathematical news from the month of May.
The film Words of Women in Mathematics in the Time of Corona showcases the words of 86 women of mathematics from 37 countries, speaking in 25 languages, on their experience during the pandemic. The project website says:
This pandemic has indeed made women, and in particular women in mathematics, more invisible than ever and we hope that this project will contribute to letting them be heard and seen.
Mathematician, IMA president and one-time World’s Most Interesting Mathematician Nira Chamberlain appeared on Jim Al-Khalili’s excellent radio show The Life Scientific, and talked about how mathematics can solve real-world problems.
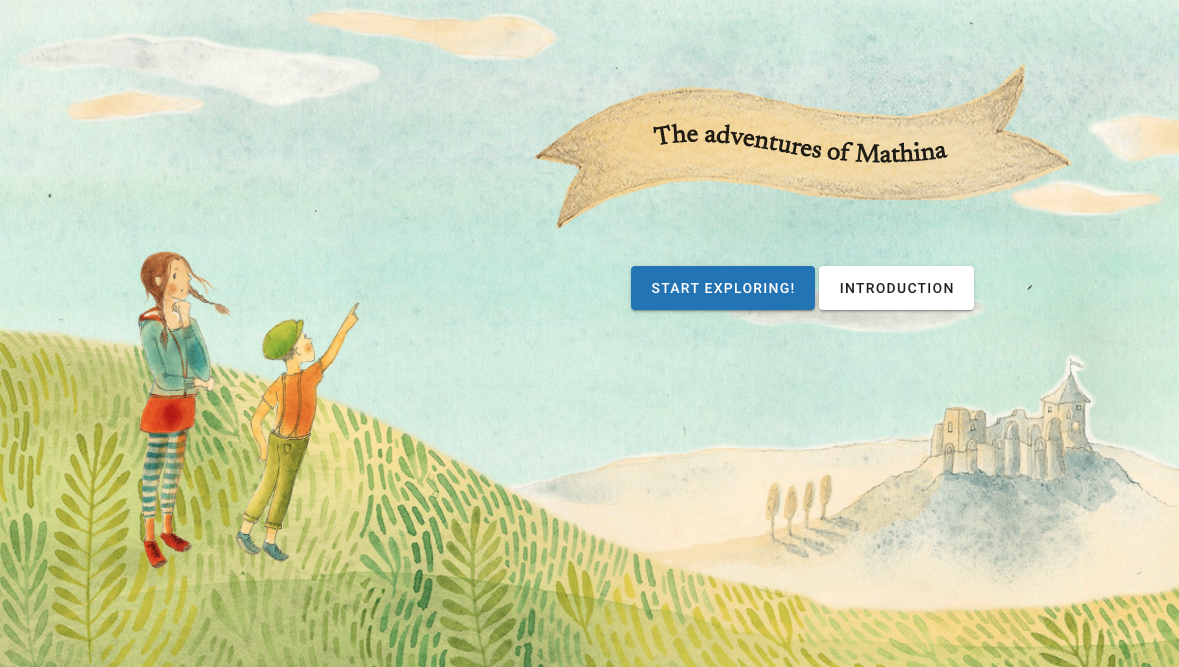
Mathina is an interactive story book, “based on story-driven experiences, in which children and young learners encounter fictional characters that find themselves in mathematical adventures”. It looks cool! (via Martin Skrodzki)
The winners of the Shaw Prize, “an international award to honour individuals who have recently achieved distinguished and significant advances in their respective fields”, have been announced for 2021, including the Shaw Prize in Mathematical Sciences. This is awarded in equal shares to Prof Jean-Michel Bismut and Prof Jeff Cheeger (pictured right, floating in an abstract mathematical universe), “for their remarkable insights that have transformed, and continue to transform, modern geometry”.
And finally, Turkish mathematician Tuna Altinel has his passport back after two years of fighting the Turkish courts. Altinel was detained by Turkish authorities and his passport confiscated on the grounds of “membership in a terrorist organisation”, due to his attempts to promote peace and support human rights as part of the group Academics for Peace.
Hannah Fry has a new TV show about maths and sport, on BT Sport and YouTube, called It’s A Numbers Game (or IT’S A NUMB3R5 GAME, if you believe the logo). She’s joined by Pippa Monique, Ugo Monye, Andrew Mensah and Dr Nick Owen. It’s on each Saturday on both BT Sport and YouTube. There are some resources for kids aged 5 to 14 on Twinkl, to go with the show.
The Institute of Mathematics and its Applications is again running a series of online talks.
The first talk at the 6th May event will be from Nick Higham who has been awarded the Gold Medal award in recognition of outstanding contributions to mathematics and its applications. This will be followed by Jane Leeks and David Abrahams discussing future developments in mathematical sciences knowledge exchange.
There will be a couple more talks on the 25th of May to do with modelling and Covid-19.
The London Mathematical Society is offering two summer placements – a Library and Special Collections Summer Placement (working with the LMS’s special collections) and an Equality and Diversity – Success Stories Placement (putting together profiles of successful mathematicians), both of which are paid hourly at three days a week for 8 weeks over the summer, and would suit prospective postgraduates with an undergraduate degree.
The International Congress of Mathematicians is running a surprising maths videos contest. Prizes include a grant to attend ICM 2022 in St Petersburg, which won’t be much use to LGBT+ mathematicians, whose existence in Russia is illegal, or Azat Miftakhov, a student at Moscow State University who has been detained by Russian authorities for two years. If that doesn’t faze you, the ICM has produced an example of a surprising maths video:
Proof news
Kelsey Houston-Edwards writes in Quanta magazine about a proof of the Erdős-Faber-Lovász conjecture on colouring hypergraphs. The preprint by Dong Yeap Kang, Tom Kelly, Daniela Kühn, Abhishek Methuku and Deryk Osthus is available on the arXiv.
Early Family Math is a new free maths resource website for children from 6 months to 6 years old. At the moment it has a lot of resources for activities, and some maths story books. They say that videos are forthcoming.
And finally, there’s a fundraiser for Mathematicians of the African Diaspora, which hosts the largest searchable database of mathematical scientists of the African Diaspora in the world, and is looking for funding to expand its database and reach a wider audience so it can continue to inspire the next generation of Black mathematicians. (via Edray Goins)
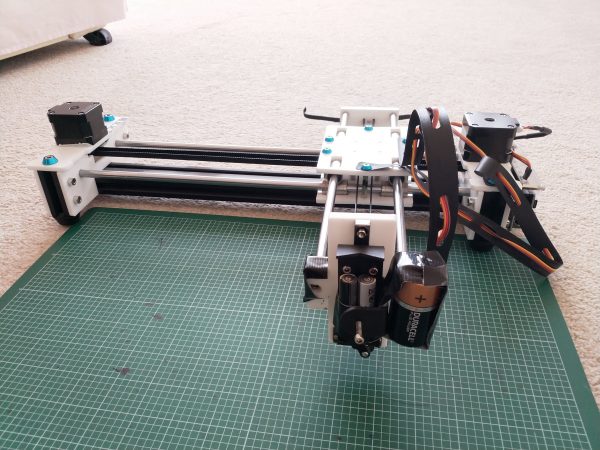
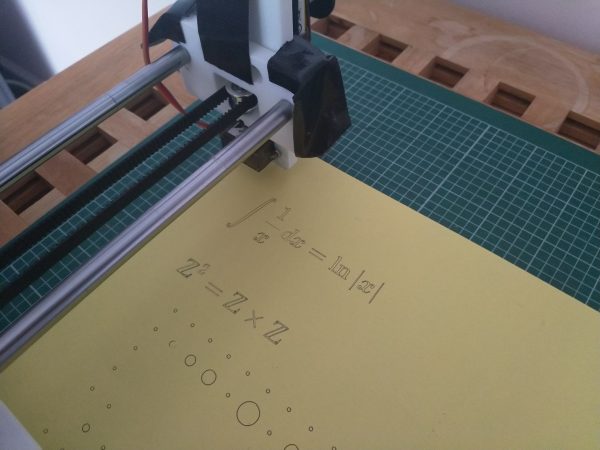
For my birthday I got an EleksDraw pen plotter. It’s a cheap and cheerful example of the form: a pair of orthogonal metal rods with a pen on the end, attached to electric motors. The idea is that I can connect it to my computer and the computer can direct it to draw things. It arrived as a kit, so first of all I had to descend from the astral plane of pure thought and – shudder – screw the bits together.
The #plottertwitter hashtag is a constant source of inspiration, where people around the world share pictures of the amazing, beautiful things they’ve made their pen plotters draw, often with the AxiDraw plotter, which differs from mine in that nobody seems to have had to attach 200g of batteries as ballast to the pen holder to overcome friction on the knacky sliding rail.
The basic idea of a pen plotter is that the pen holder is free to move in the plane, constrained by the lengths of the two axes. If there’s a pen in the holder and paper underneath as it moves, then a drawing happens. The pen holder can move up and down, to lift the pen away from the paper so it can move without drawing.
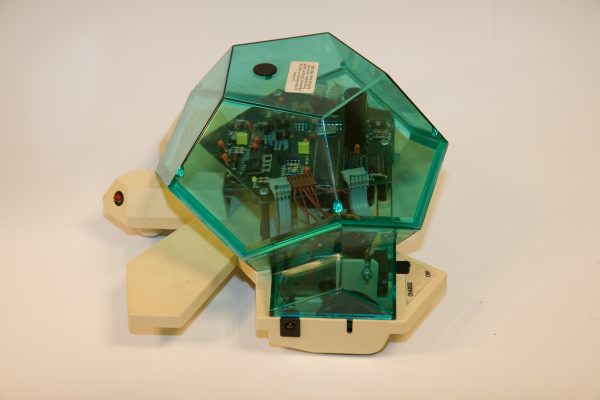
The instructions you can give the plotter are quite straightforward: move in a straight line to these coordinates; move the pen up or down; move back to the ‘home’ position. It’s a lot like the turtle drawing robot I played with in primary school.
A Valiant turtle robot, similar to the one I used in primary school. Photo from National Education Network.
You can either directly write a list of instructions for the plotter, or write some code that takes a vector image and produces a corresponding set of instructions. SVG is a widely-used vector graphics format, so it’s a common choice of input for pen plotters.
This was very pleasing to watch.
So I was playing around with my pen plotter, getting it to draw space-filling curves and geometrical diagrams, when I decided that I should get it to draw text. It turns out that there are a few ready-made “fonts” for plotters that give paths to write letters with strokes instead of filling in shapes, so that was nice and easy.
But then I wanted to write mathematical notation, and I remembered: MathJax has an SVG output! It didn’t take long to write a bit of JavaScript that takes some maths written in LaTeX and gets MathJax to produce the corresponding SVG code and insert it into the picture, ready for my plotter to draw.
The remaining problem is that MathJax’s fonts produces shapes that should be filled in, which is easy on a computer screen, but the pen plotter just draws their outlines. That’s not much of a problem, though: I just had to trace over the symbols in Inkscape, and replace each instance of a MathJax symbol with my single-stroke traced version.
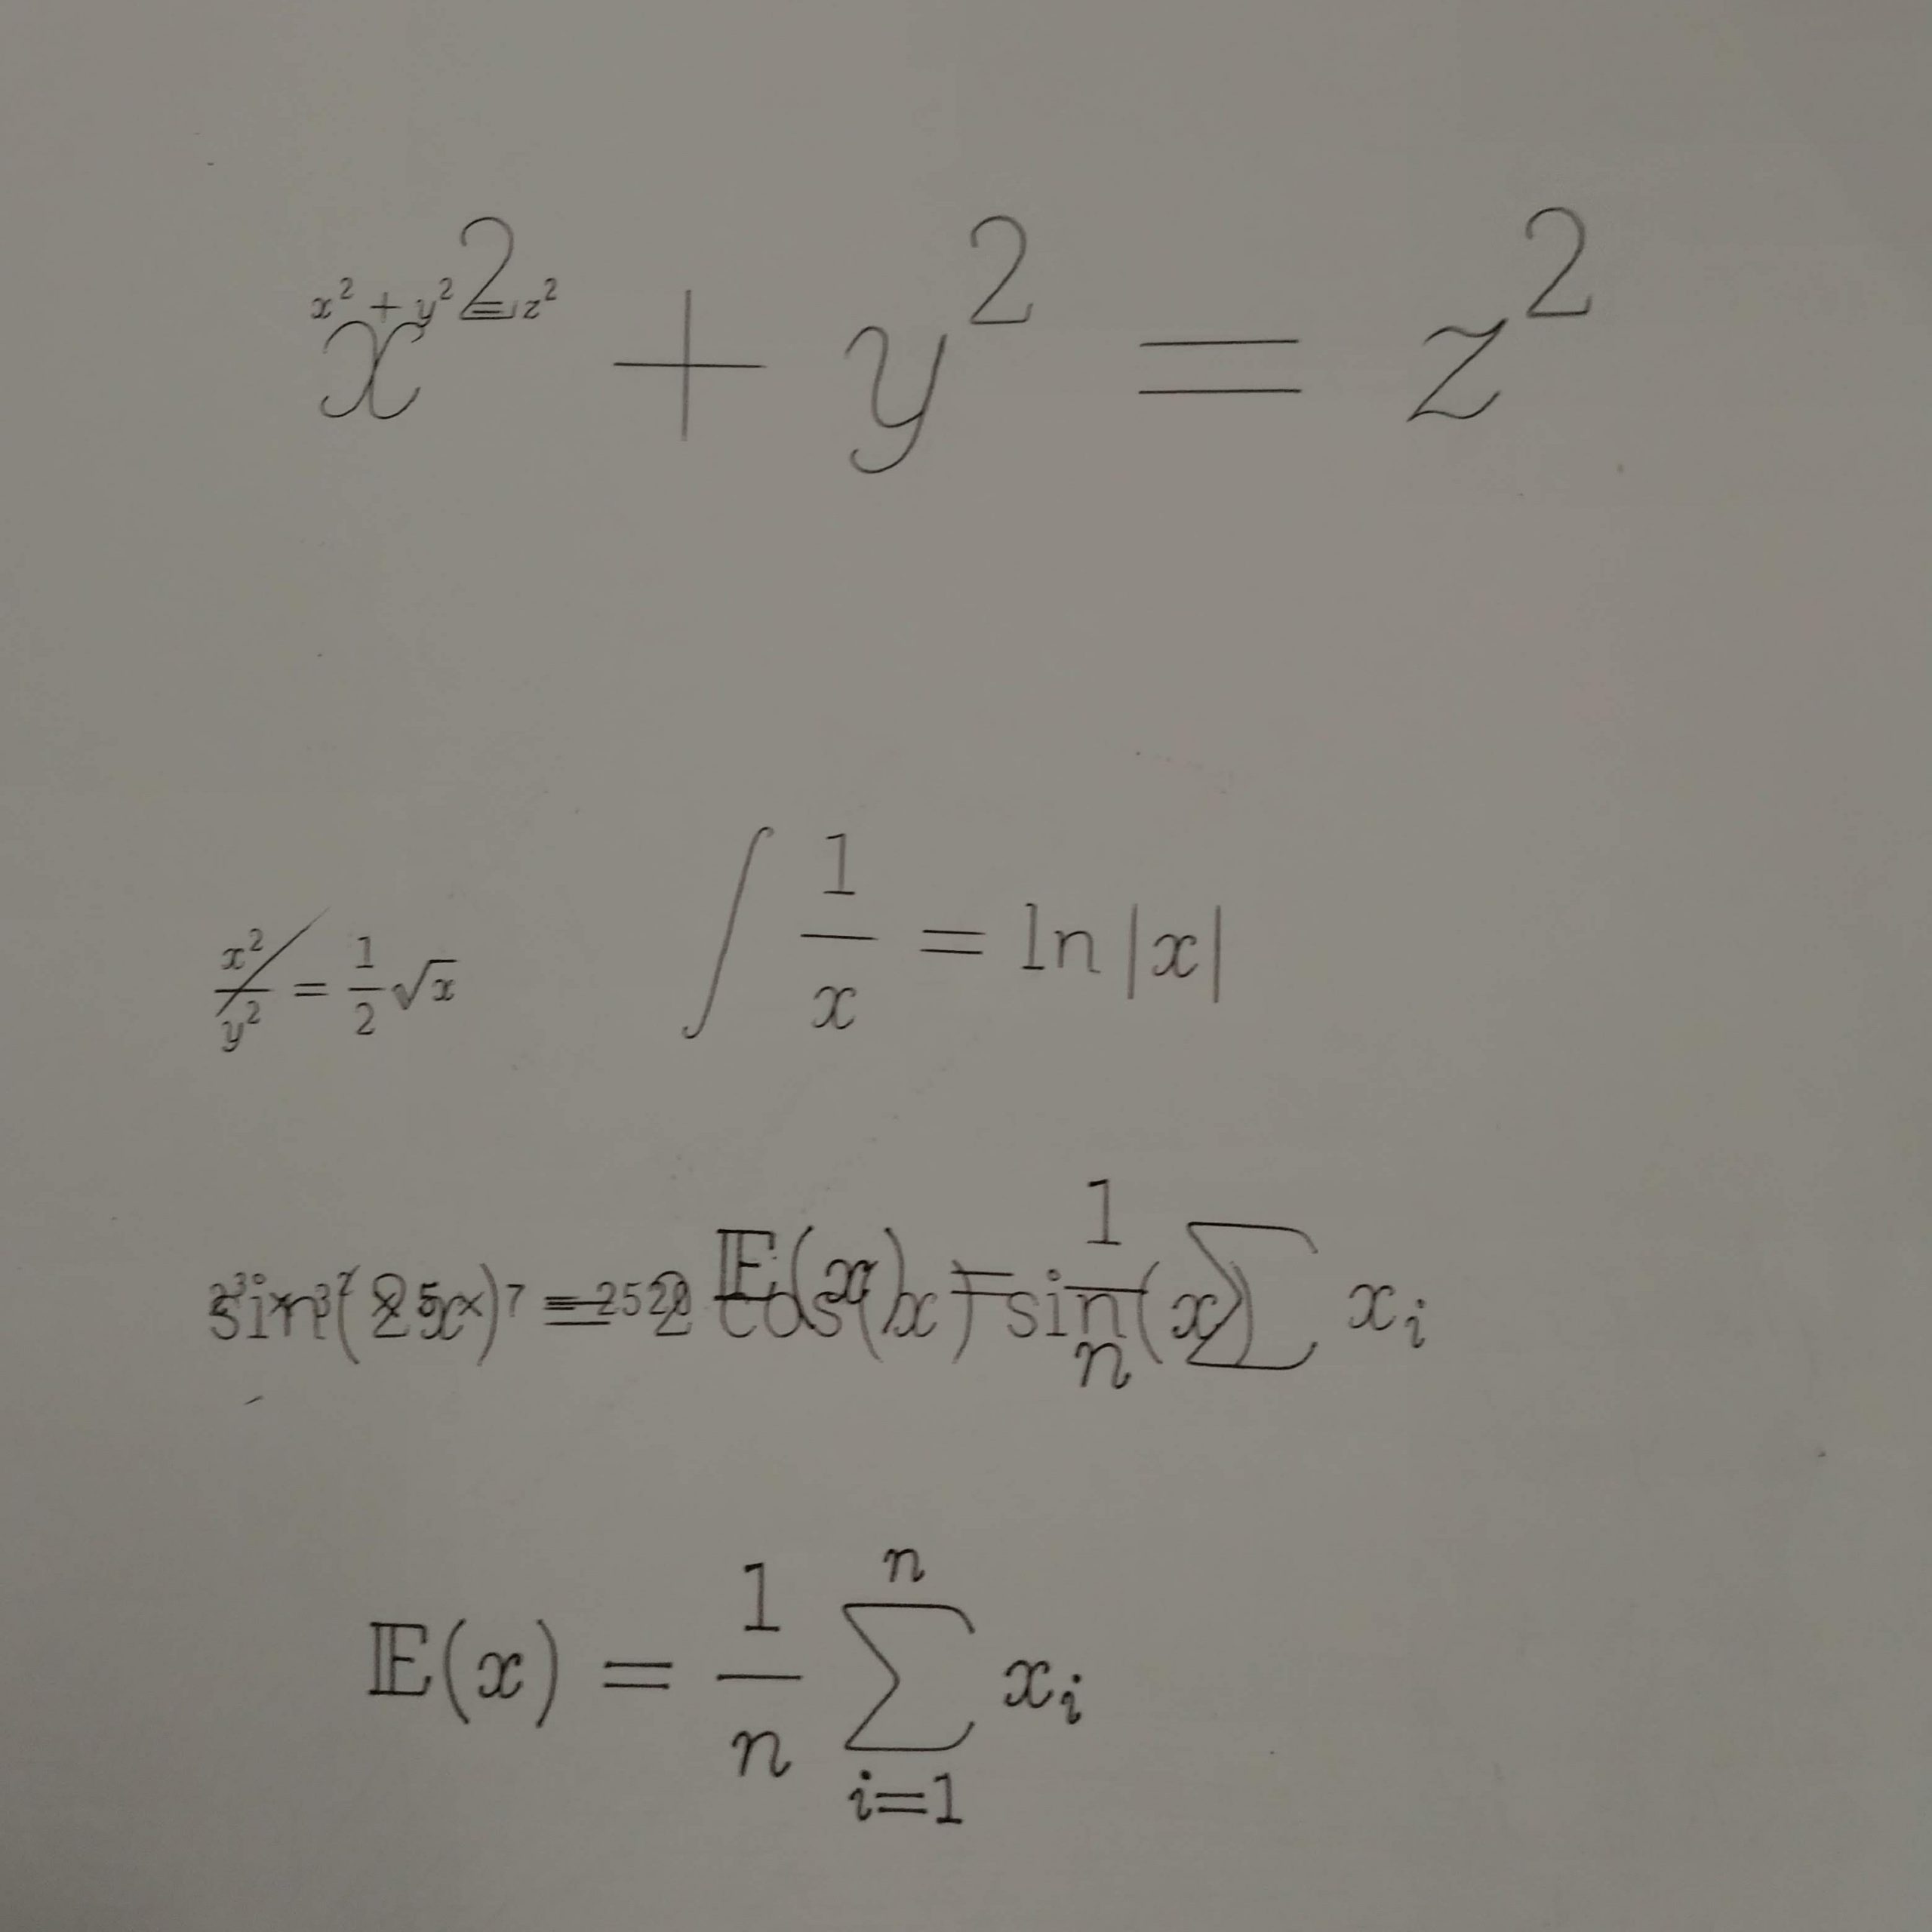
Success! But it looks like a mathematical crime scene with those outlines.
There are squillions of symbols in the TeX fonts, and I didn’t want to have to trace them all before I could draw anything, so I decided to do it bit-by-bit. I added a step to my MathJax → SVG tool to capture any symbols in the output that hadn’t been traced yet and produce an SVG file I could load into Inkscape. After tracing over those symbols, my code absorbed them into its library of replacements. I wasn’t too careful to be precise with my traced symbols – I wanted it to look as much like handwriting as I could manage.
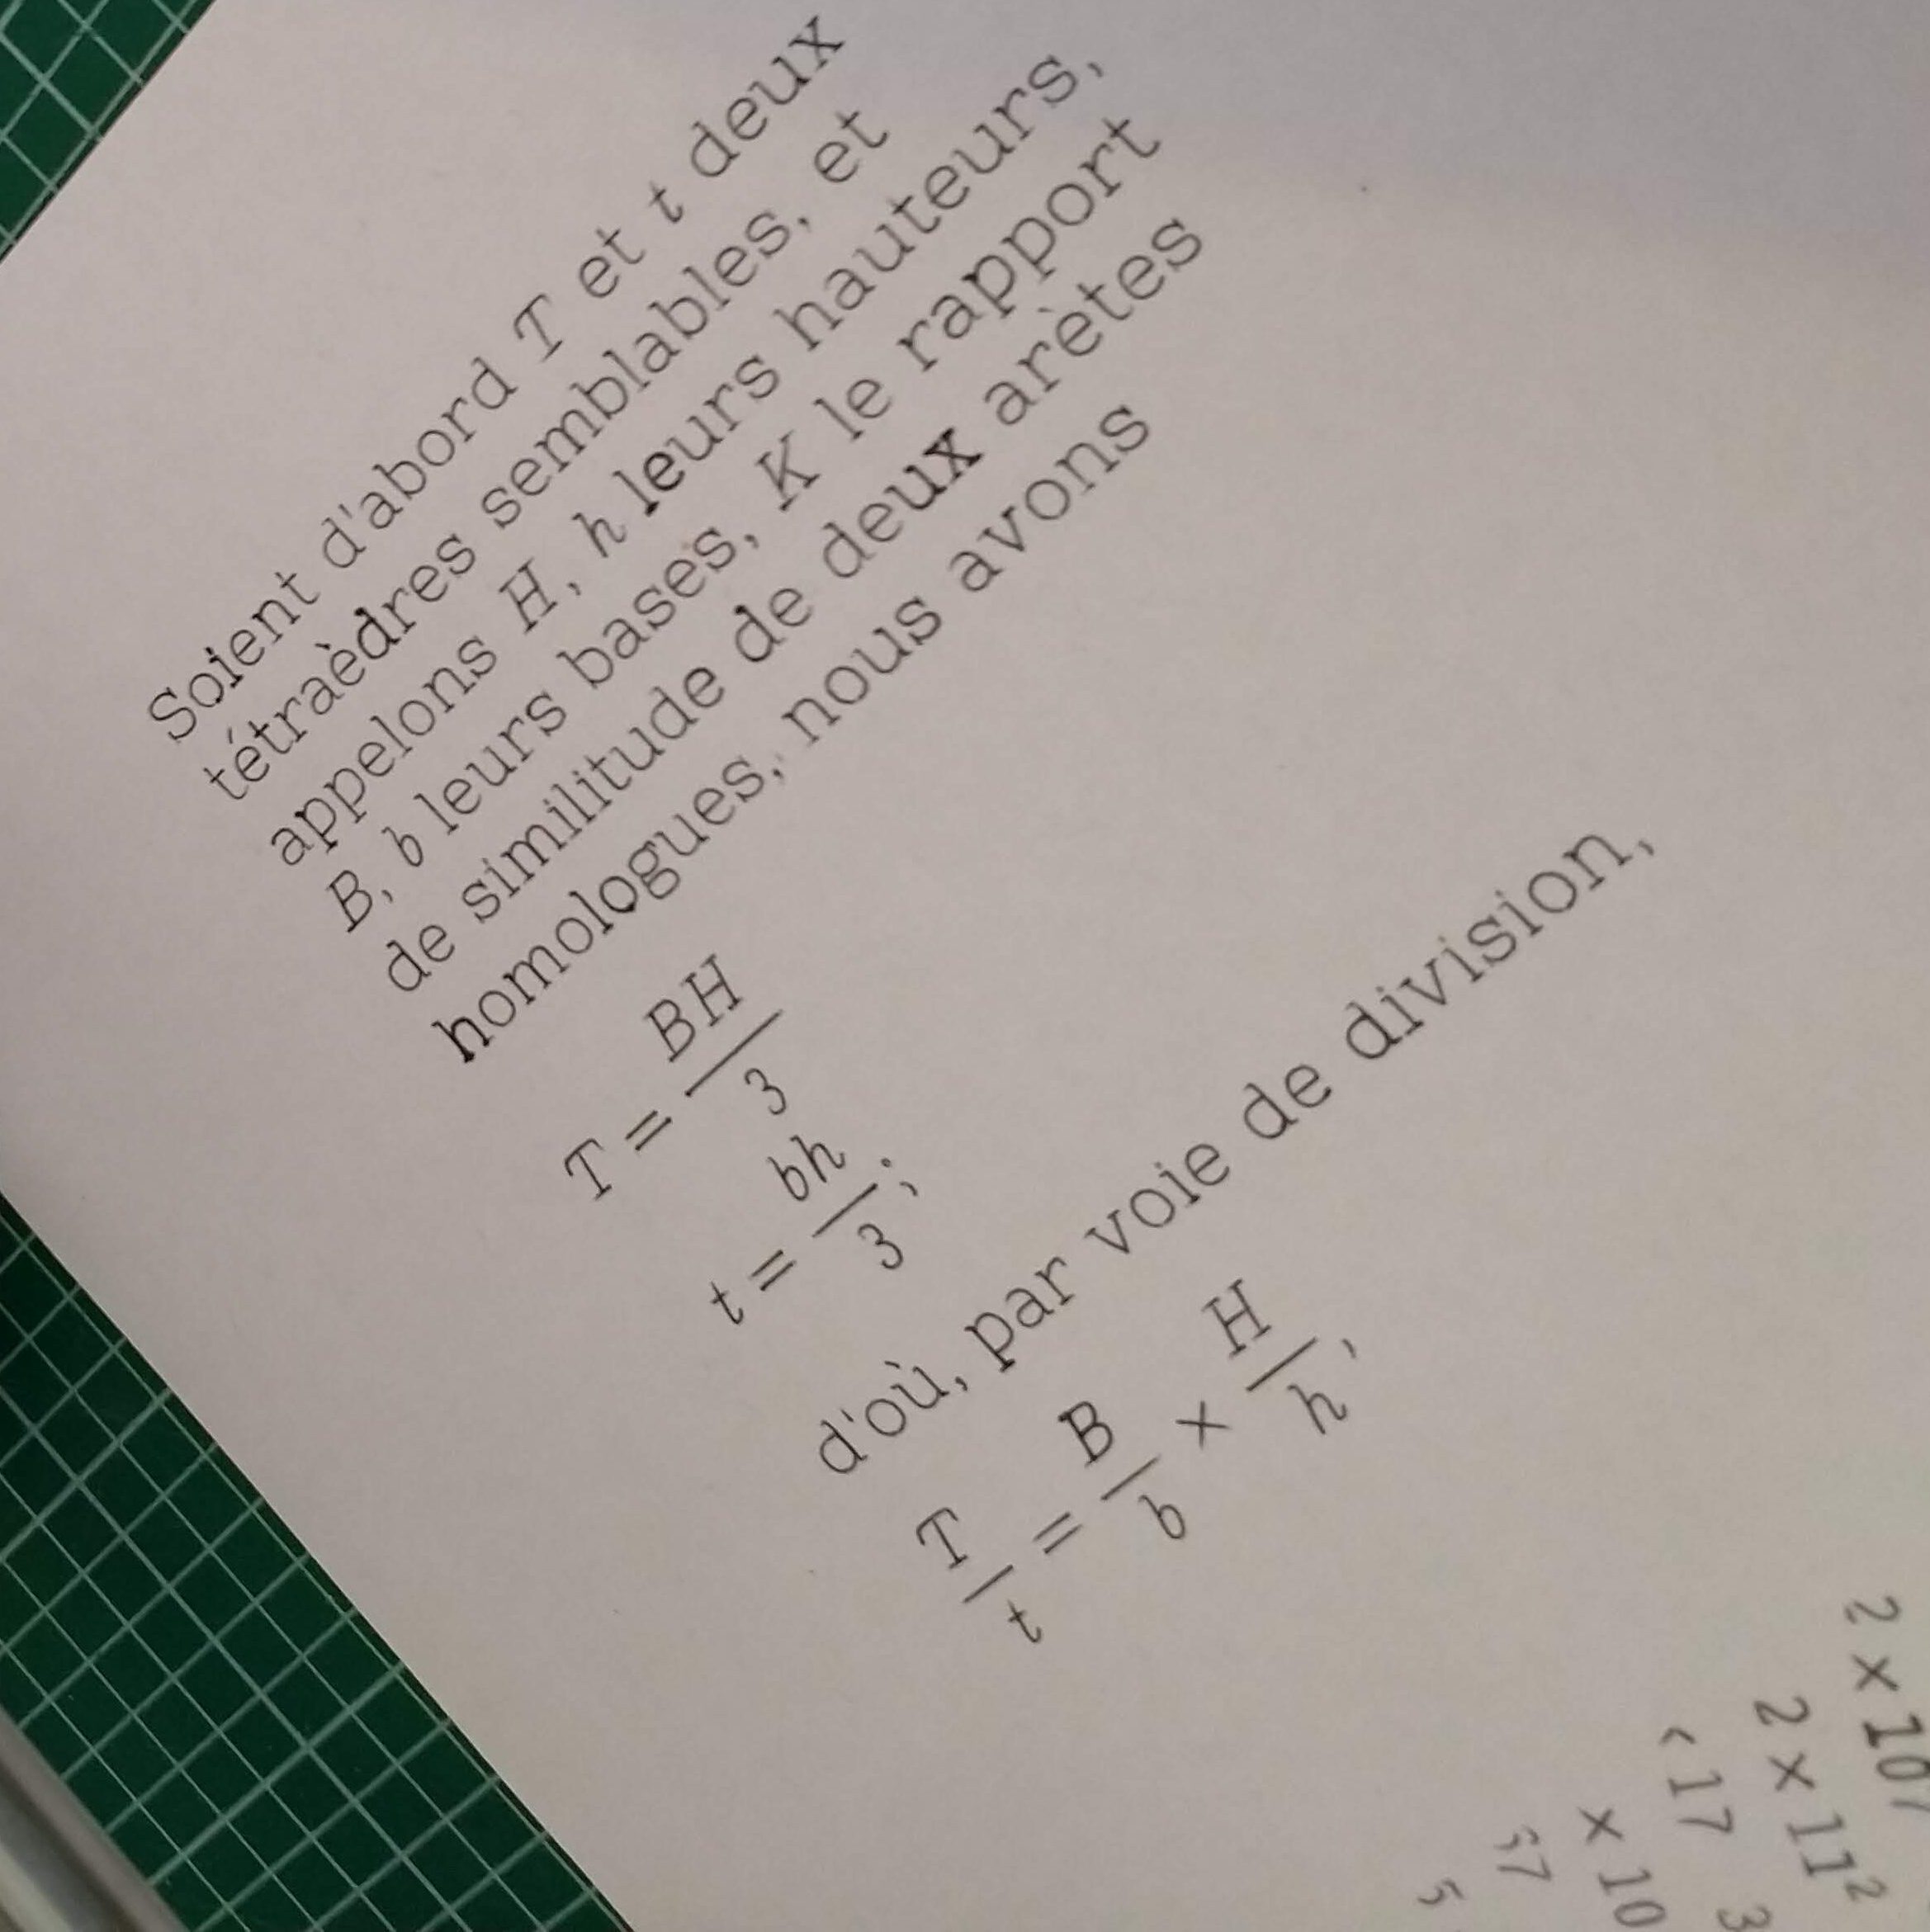
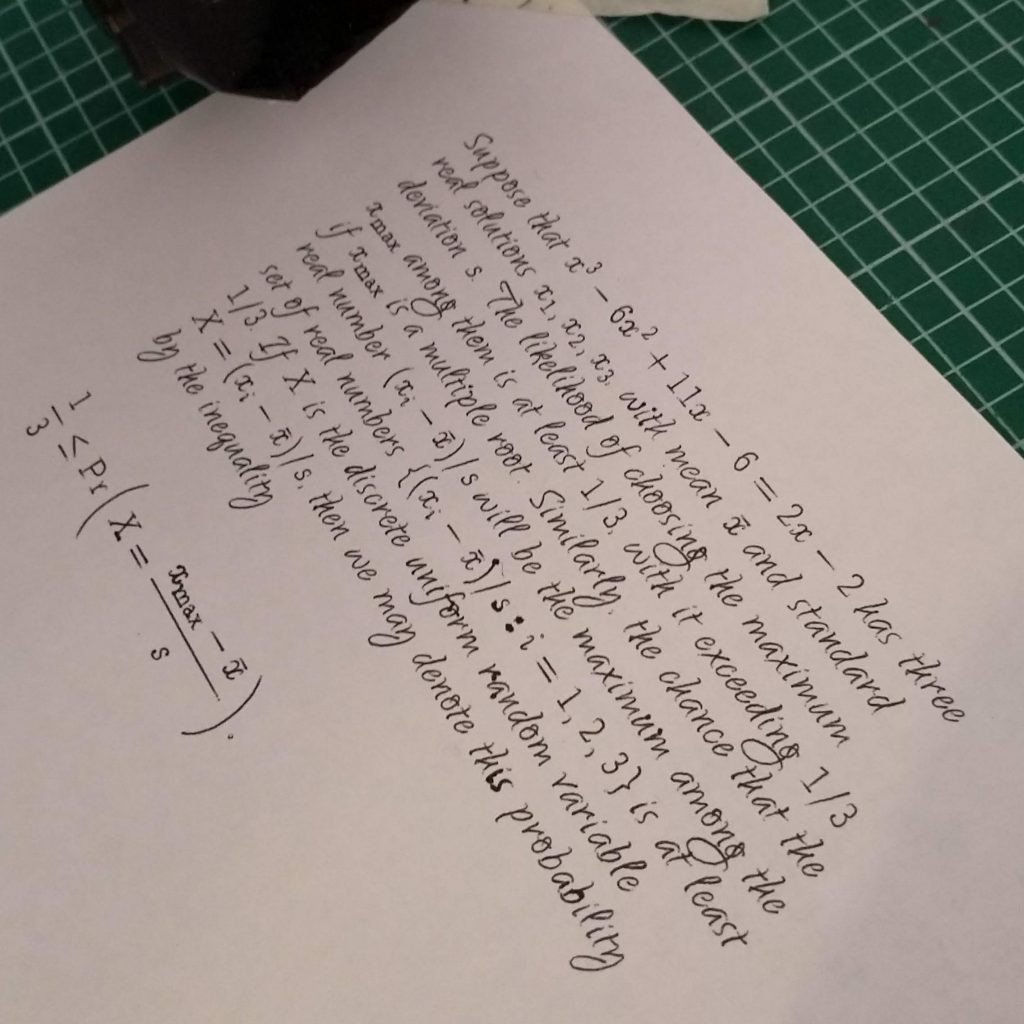
My first few traced symbols. They already look a lot better, and more like handwriting, than the standard TeX fonts.Starting to draw TeX inline with plain text. The font I chose for the plain text made it look a bit too much like the product of a typewriter. The text is from Éléments de Géométrie of 1885 by L’Abbé M. Reydellet, another birthday present.This looks much better! The text is drawn from Philip Ording’s brilliant 99 Variations on a Proof.
The fantastic thing about MathJax is that it does a lot of work to match its output with the size of the surrounding plain text, so the results looked really good straight away.
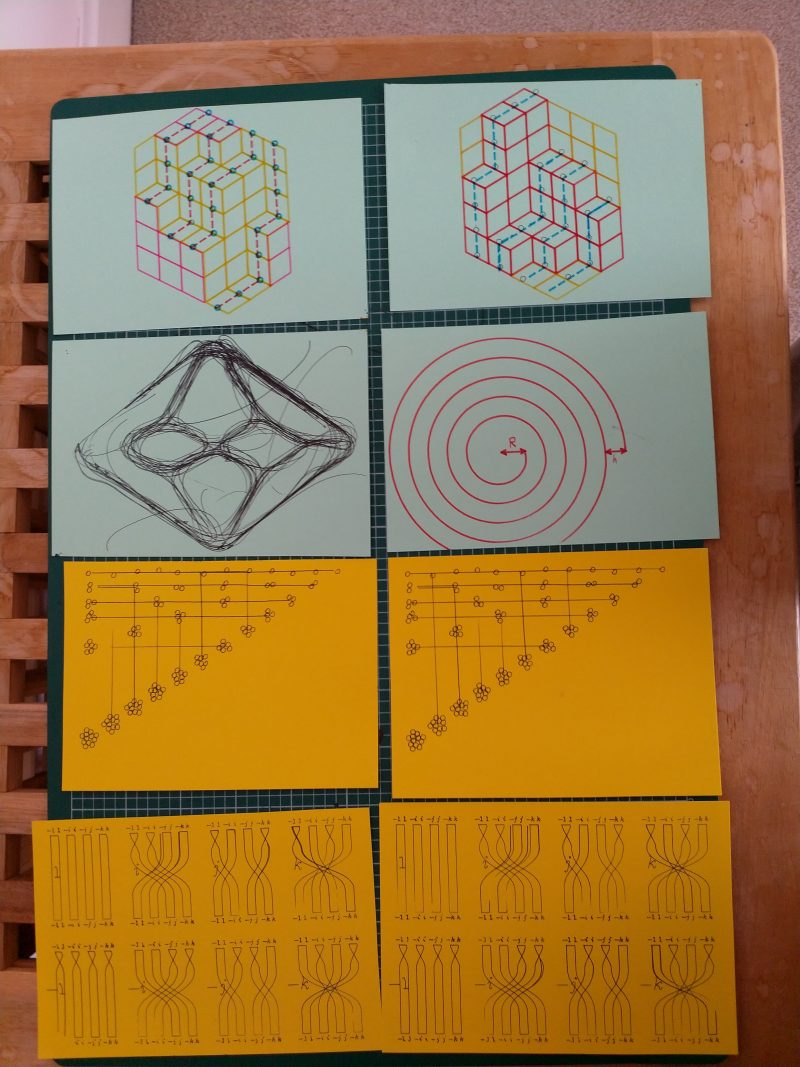
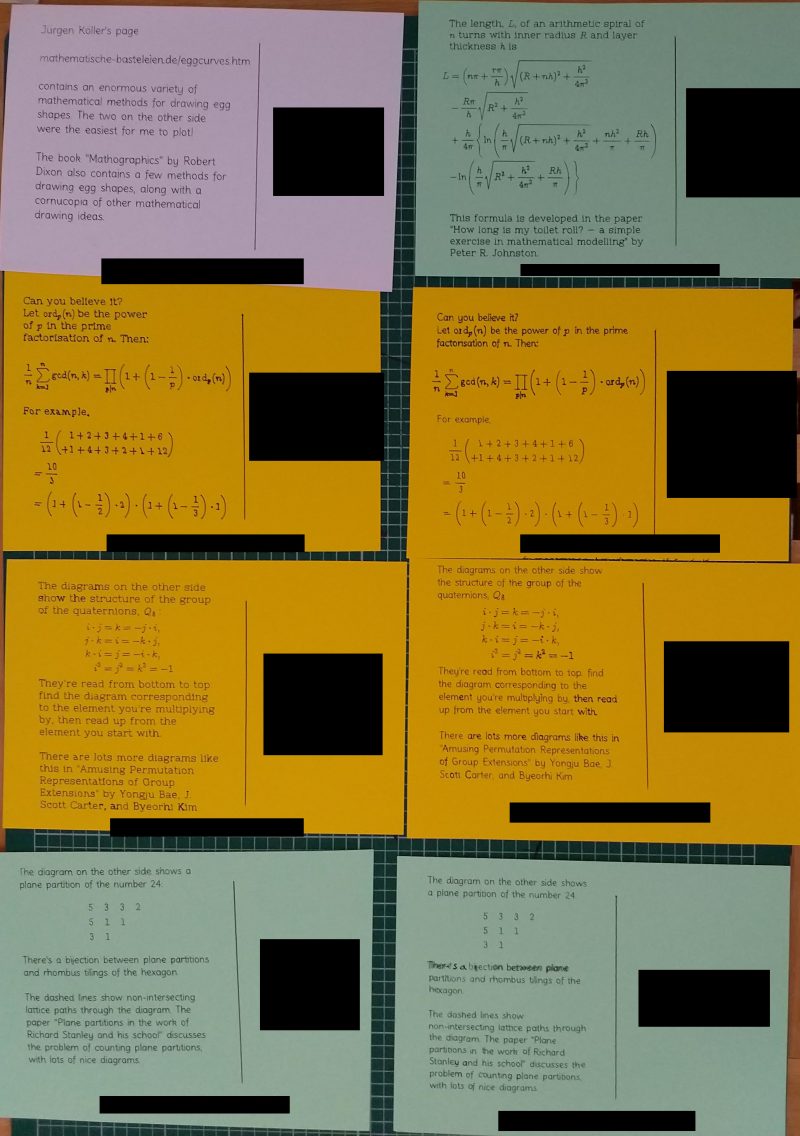
I decided to draw some mathematical postcards to send to my maths pals. On one side I drew a picture, and on the other side I wrote a passage of text about it, often with plenty of mathematical notation.
The “front” sides of my first batch of postcards.The “back” sides, with explanations of the diagrams. You can see a few places where the pen went awry or failed to drop down, so I had to make it draw over some sections a couple more times.