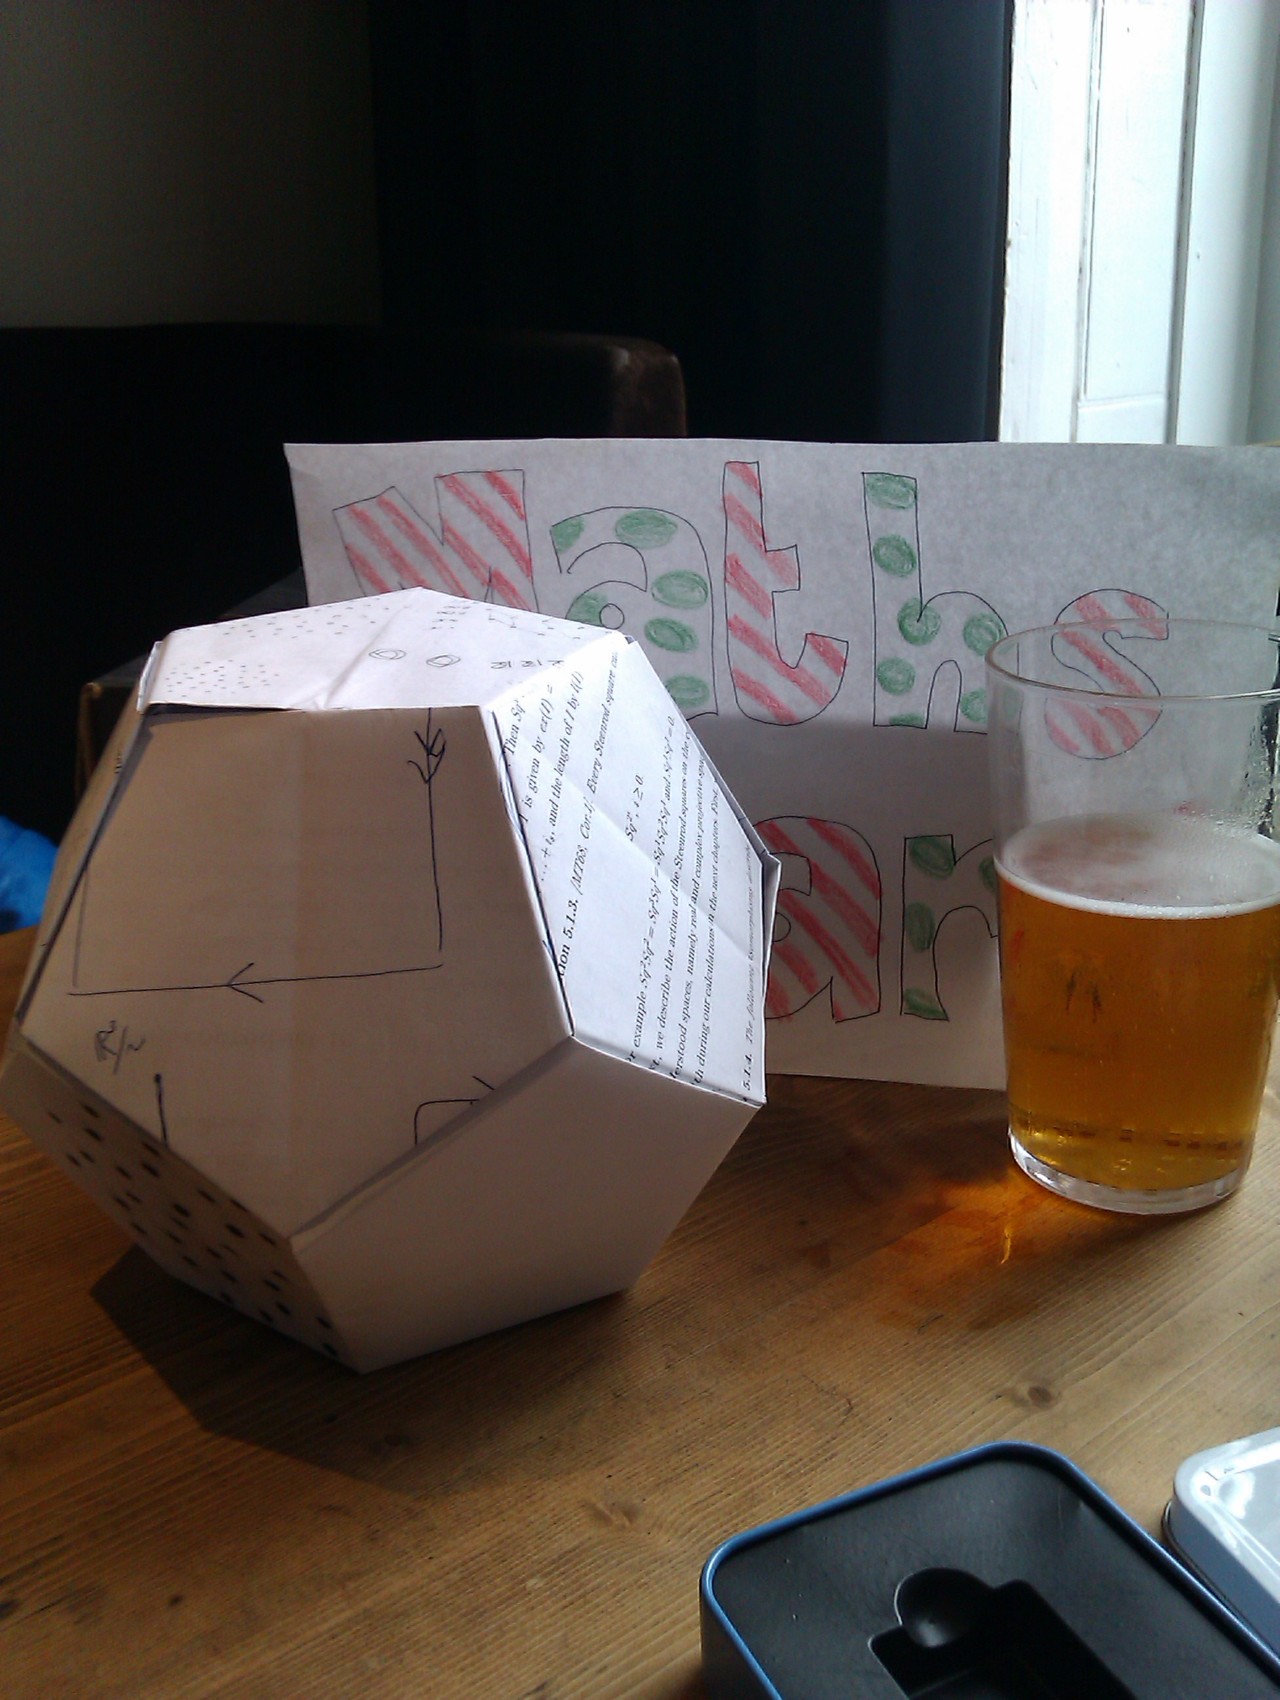
Money Polyhedra by Kristi Malakoff:

Money Polyhedra by Kristi Malakoff:
I gave a talk to our internal postgrad forum last week about the princess in a castle puzzle. I made some slides for it using deck.js. They looked quite nice and I could just about get what I wanted in them, but I now know that using SVG in HTML is still an enormous faff if you want it to scale nicely, which is basically the only reason you would use SVG.
I’m not sure if you can follow along with the slides without me talking; maybe I’ll do a transcript with slide drive later.
Continue reading “Slides about the princess in a castle puzzle” on cp’s mathem-o-blog

Minecraft is a game where you mine and craft. There is a substance called redstone which you can mine, and craft into circuits. Even making simple logic gates is quite finicky. That hasn’t stopped people from trying to make more complicated things like adders.
Somebody has made a scientific calculator with a proper display and a graph plotter.
[youtube url=http://www.youtube.com/watch?v=wgJfVRhotlQ]
I am agog.
Mike Croucher has written a post about the next incarnation of the Carnival of Maths, which we are coordinating.

This visualisation shows for each council or unitary authority how many hours a week you’d need to work, earning minimum wage, in order to pay the median rent for a one-bed flat. The minimum wage is a national constant.
No justification is given for using the median rent. In a fair world, the median rent should be paid by someone on the median income. Assuming that people earning the minimum wage are the lowest earners1 and make up X% of the population, then an upper bound for rent paid by people earning minimum wage should be the Xth percentile, if housing is provided fairly2.
Continue reading “Visualising the wrong data on the Guardian data blog” on cp’s mathem-o-blog


