I’ve made a little game.
I’ve made a little game.
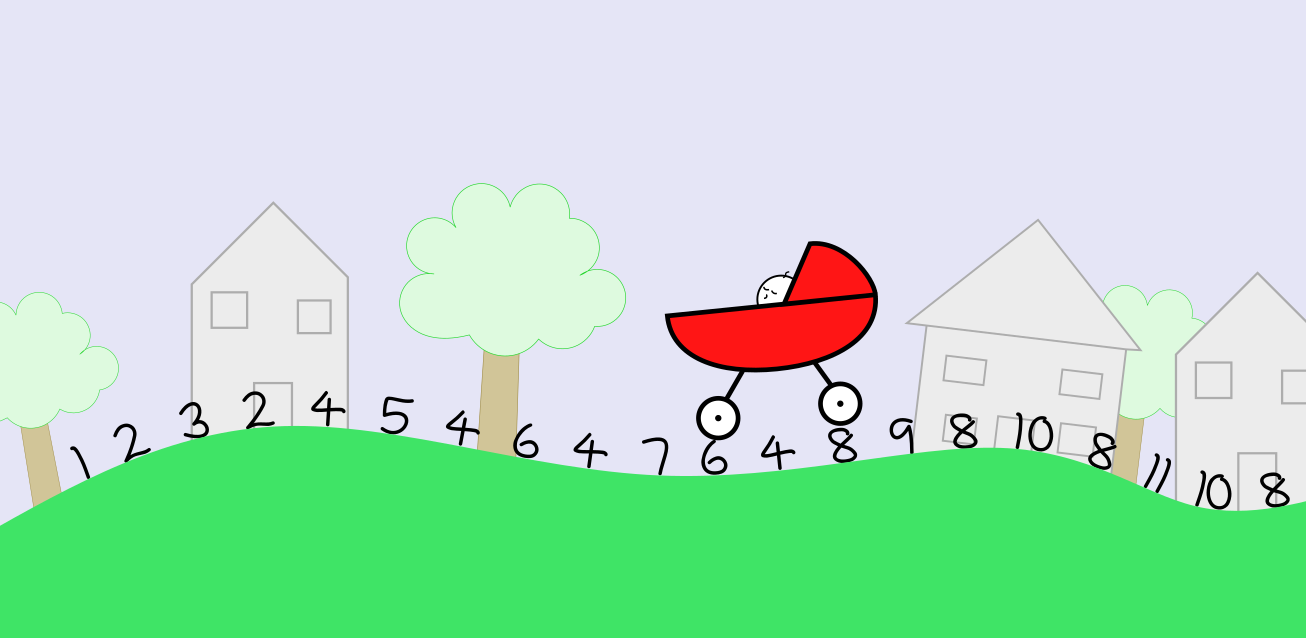
My son was born last September. While he doesn’t hate sleep as much as his sister did, he still needs a bit of help to drop off.
I’m not at all musically inclined, and I seem unable to remember more than a couple of lines from wordy songs (my version of “Papa’s gonna buy you a mockingbird” rapidly veers into nonsense as I try to think of a rhyme for the next line), so when the girl was little I hit upon the strategy of singing counting songs to lull her off to sleep.
I’m now the owner of WhyStartAt.xyz, thanks to my past self’s successful campaign of Twitter peer pressure against my more recent self.
My aim is to collect examples of conventions in mathematical notation that lead to ambiguities, inconsistencies, or just make you feel yucky. This is largely a result of me wishing I had something to point to whenever I see $\sin^2$ or one of those viral “puzzles” relying on BODMAS.
I’ve set it up as a wiki, so you can edit it too. So far, it’s got a few dozen pages on some of the things that have troubled me over the years, along with some contributions from some of my maths pals, such as “There is no function application symbol”, “Parentheses are overused”, and “Juxtaposition means combine in the obvious way”.
My aim is to describe conventions, without prescribing a correct notation. Whenever I tweet a question about a notational convention, my aim is to find out the range of different opinions that people hold about it. I often get replies arguing authoritatively for a particular correct answer, usually followed up by an equally certain reply from someone else arguing for the opposite. Like all language, mathematical notation is just something we make up to help express our ideas, and opinions, abuses of notation, lapses in memory and convenience all work against consistency and clarity.
I’d like the site to collect all these difficult aspects of notation, so that they don’t trip up someone who thought they might have an easy day doing maths.
So, have a look, and if you can help to build it out, I’d be very happy!
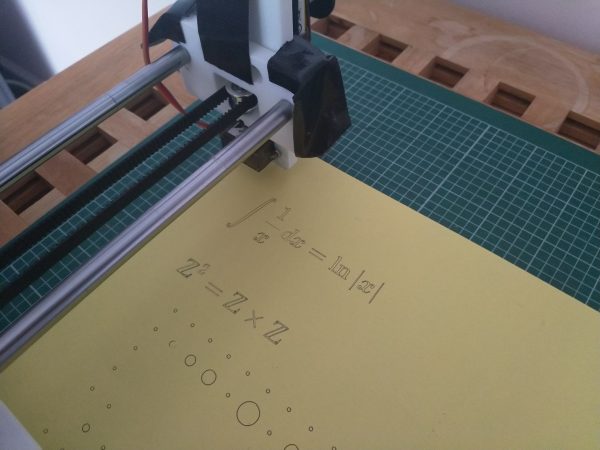
For my birthday I got an EleksDraw pen plotter. It’s a cheap and cheerful example of the form: a pair of orthogonal metal rods with a pen on the end, attached to electric motors. The idea is that I can connect it to my computer and the computer can direct it to draw things. It arrived as a kit, so first of all I had to descend from the astral plane of pure thought and – shudder – screw the bits together.
The #plottertwitter hashtag is a constant source of inspiration, where people around the world share pictures of the amazing, beautiful things they’ve made their pen plotters draw, often with the AxiDraw plotter, which differs from mine in that nobody seems to have had to attach 200g of batteries as ballast to the pen holder to overcome friction on the knacky sliding rail.
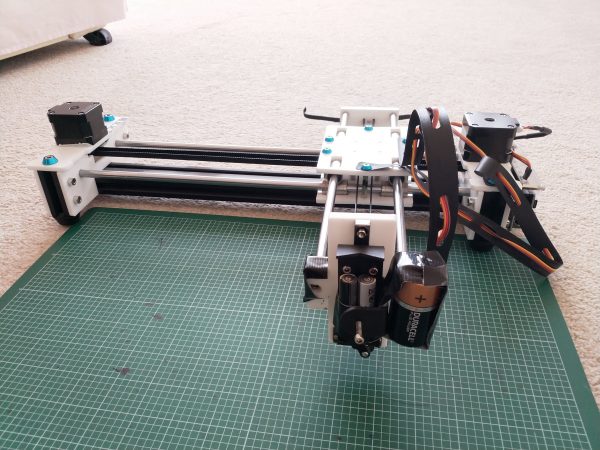
The basic idea of a pen plotter is that the pen holder is free to move in the plane, constrained by the lengths of the two axes. If there’s a pen in the holder and paper underneath as it moves, then a drawing happens. The pen holder can move up and down, to lift the pen away from the paper so it can move without drawing.
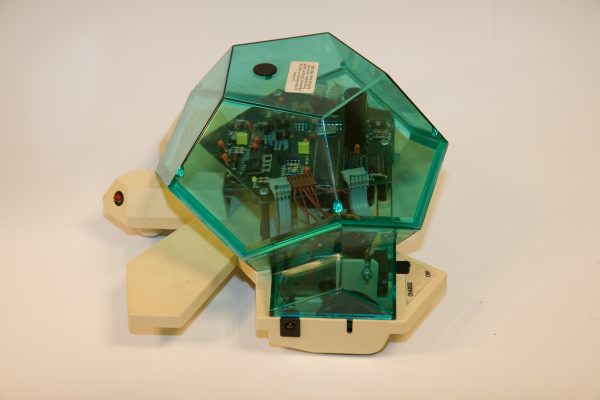
The instructions you can give the plotter are quite straightforward: move in a straight line to these coordinates; move the pen up or down; move back to the ‘home’ position. It’s a lot like the turtle drawing robot I played with in primary school.
You can either directly write a list of instructions for the plotter, or write some code that takes a vector image and produces a corresponding set of instructions. SVG is a widely-used vector graphics format, so it’s a common choice of input for pen plotters.
So I was playing around with my pen plotter, getting it to draw space-filling curves and geometrical diagrams, when I decided that I should get it to draw text. It turns out that there are a few ready-made “fonts” for plotters that give paths to write letters with strokes instead of filling in shapes, so that was nice and easy.
But then I wanted to write mathematical notation, and I remembered: MathJax has an SVG output! It didn’t take long to write a bit of JavaScript that takes some maths written in LaTeX and gets MathJax to produce the corresponding SVG code and insert it into the picture, ready for my plotter to draw.
The remaining problem is that MathJax’s fonts produces shapes that should be filled in, which is easy on a computer screen, but the pen plotter just draws their outlines. That’s not much of a problem, though: I just had to trace over the symbols in Inkscape, and replace each instance of a MathJax symbol with my single-stroke traced version.
There are squillions of symbols in the TeX fonts, and I didn’t want to have to trace them all before I could draw anything, so I decided to do it bit-by-bit. I added a step to my MathJax → SVG tool to capture any symbols in the output that hadn’t been traced yet and produce an SVG file I could load into Inkscape. After tracing over those symbols, my code absorbed them into its library of replacements. I wasn’t too careful to be precise with my traced symbols – I wanted it to look as much like handwriting as I could manage.
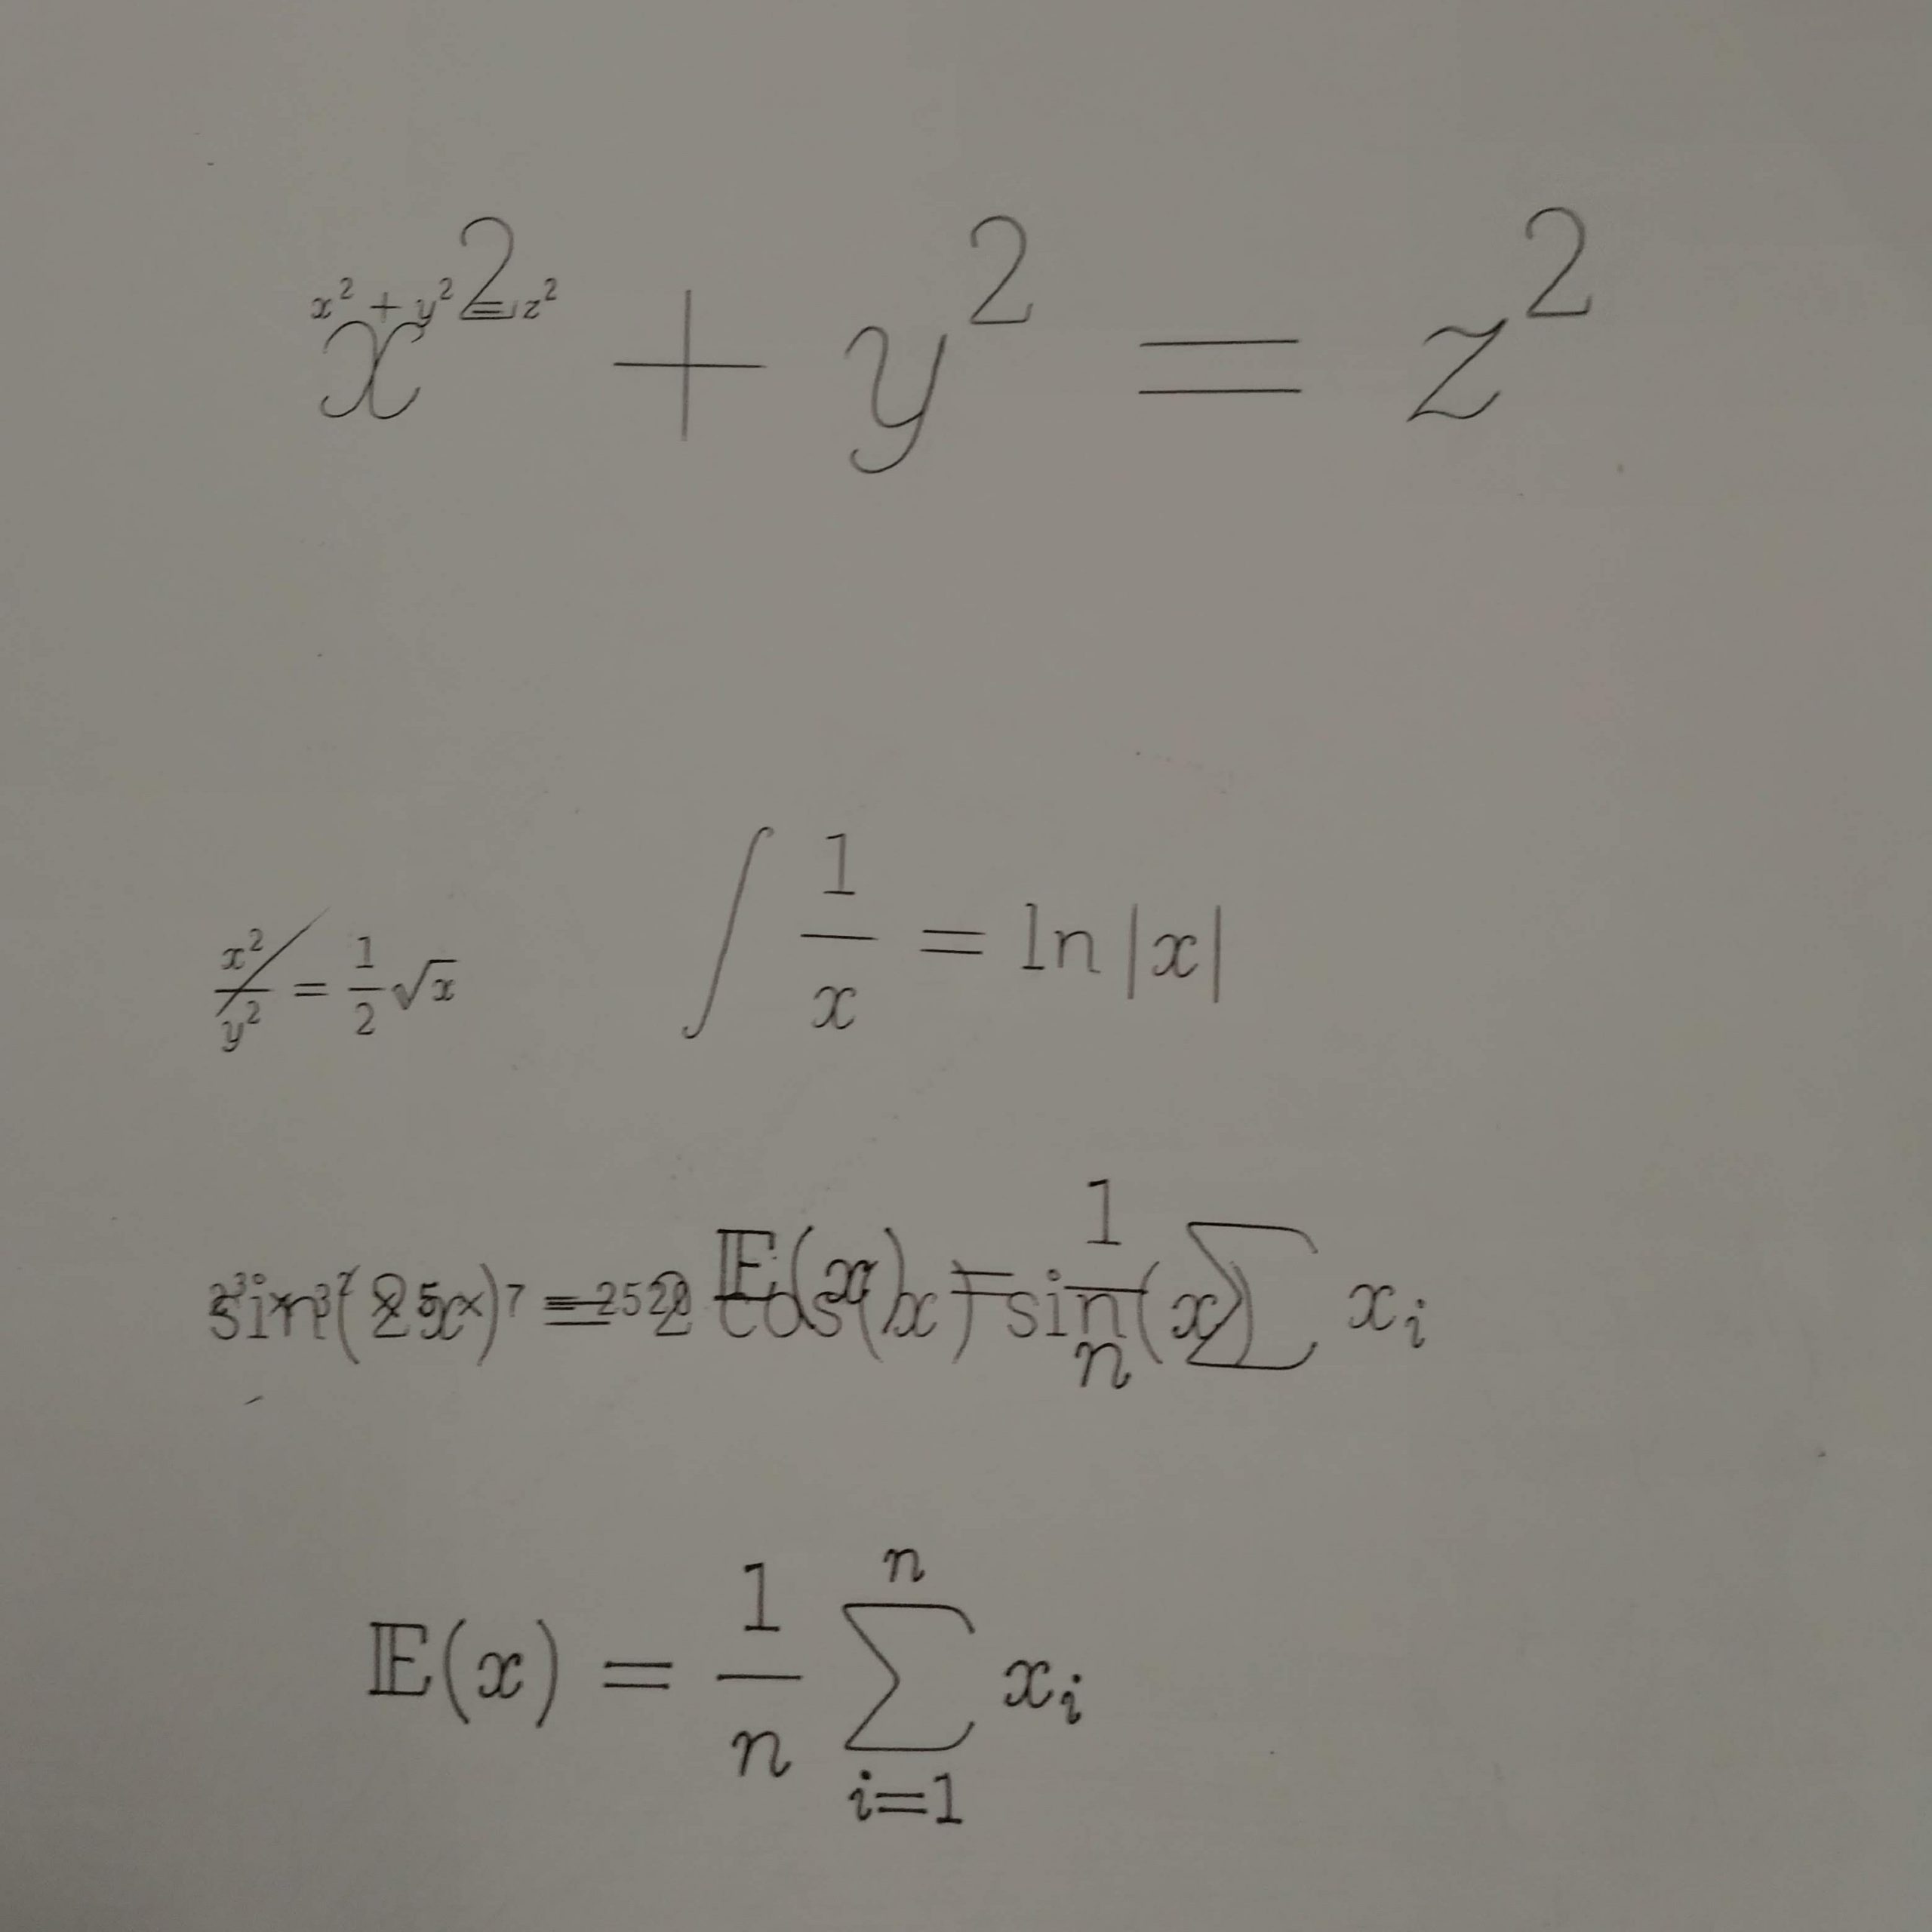
The fantastic thing about MathJax is that it does a lot of work to match its output with the size of the surrounding plain text, so the results looked really good straight away.
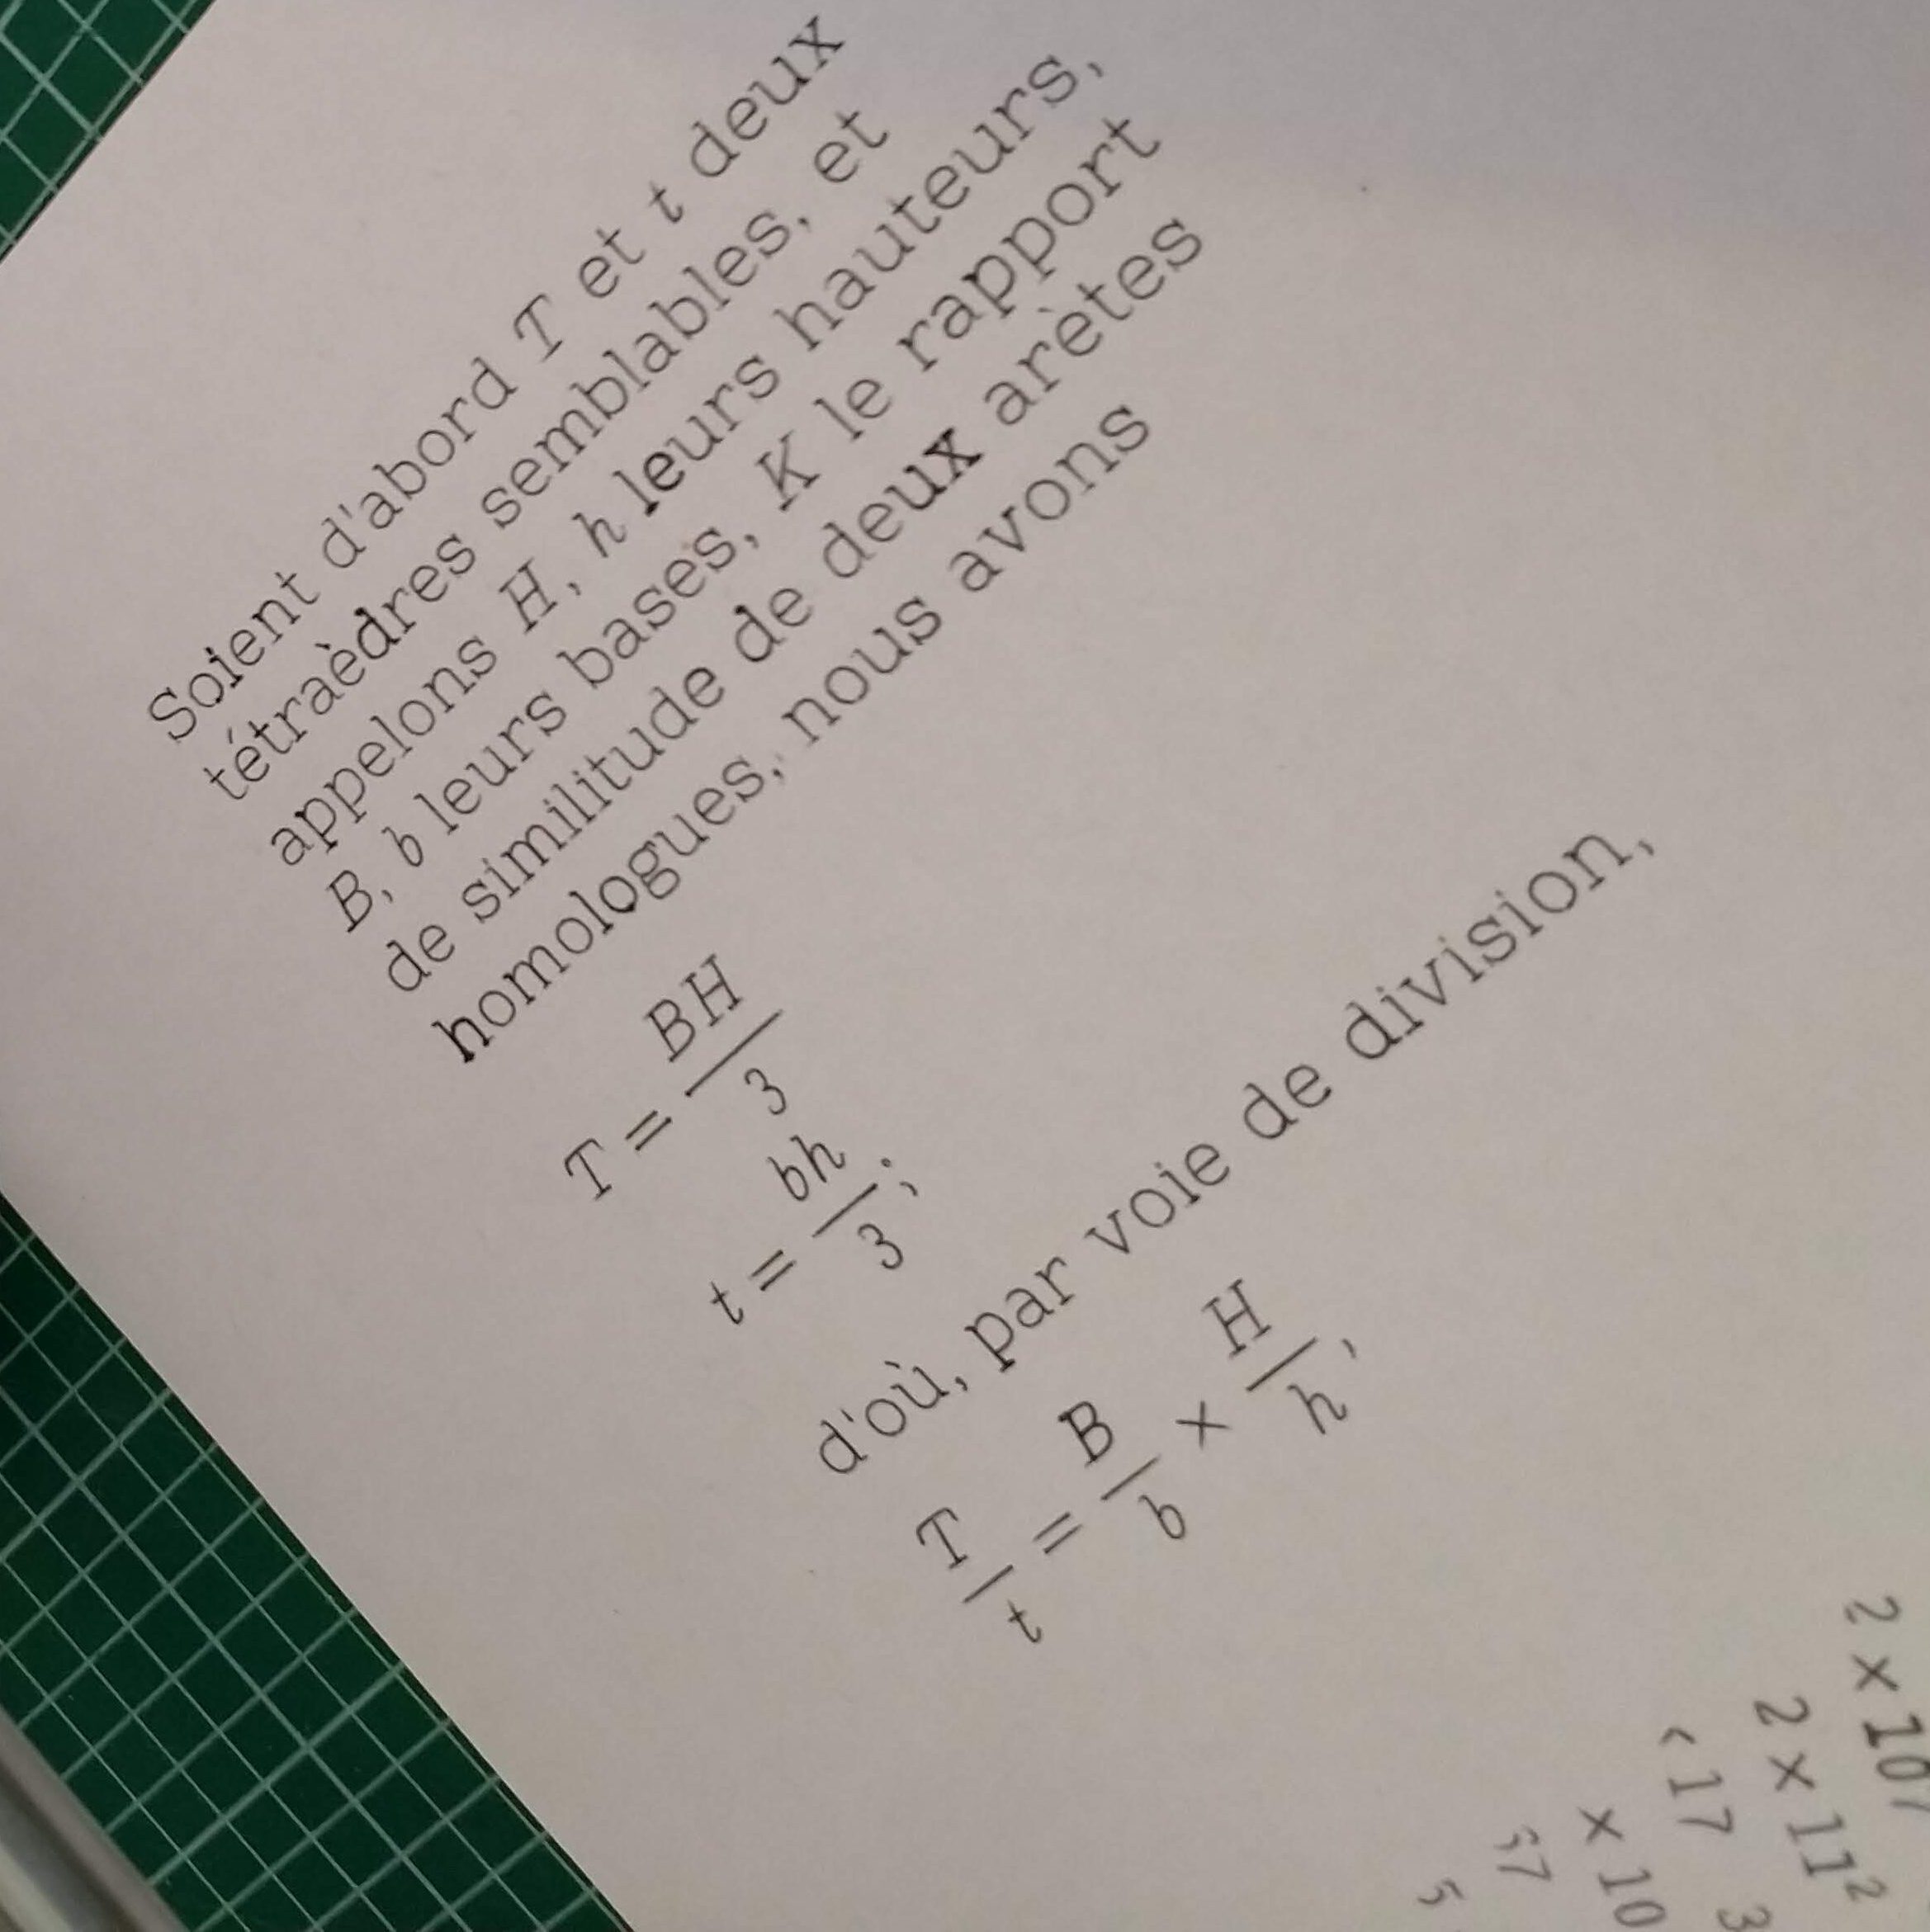
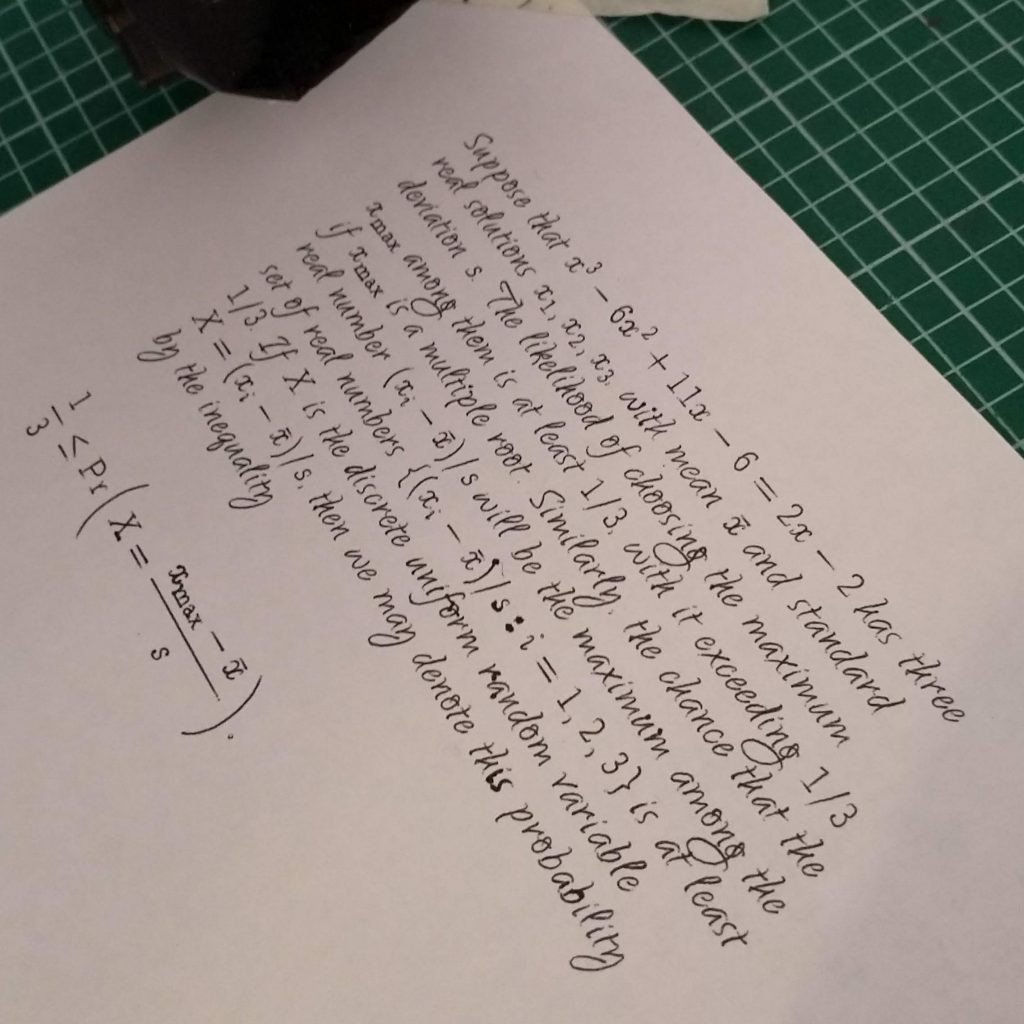
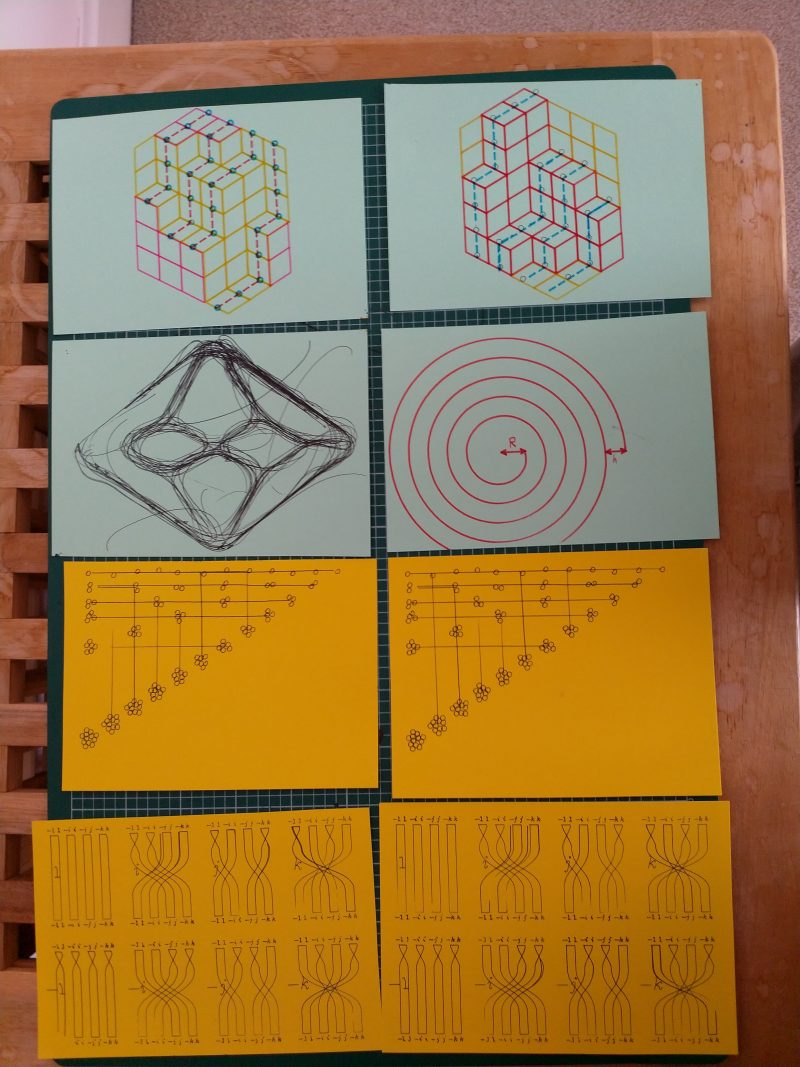
I decided to draw some mathematical postcards to send to my maths pals. On one side I drew a picture, and on the other side I wrote a passage of text about it, often with plenty of mathematical notation.
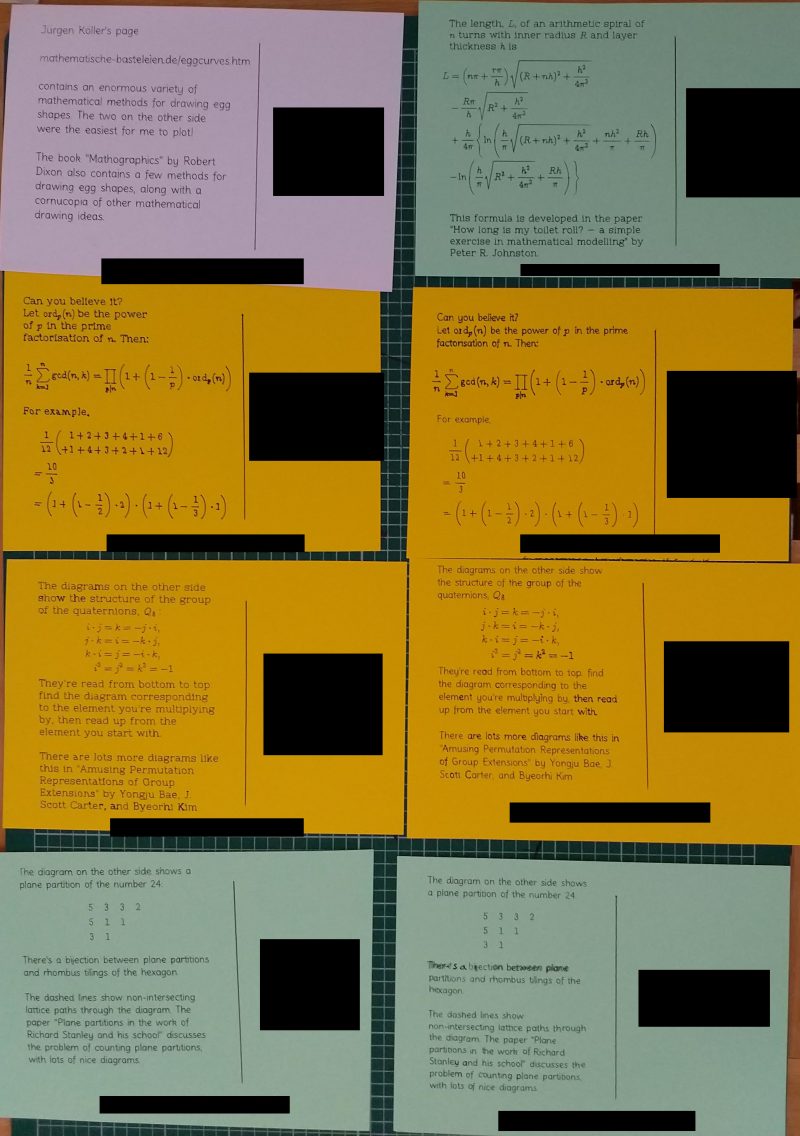
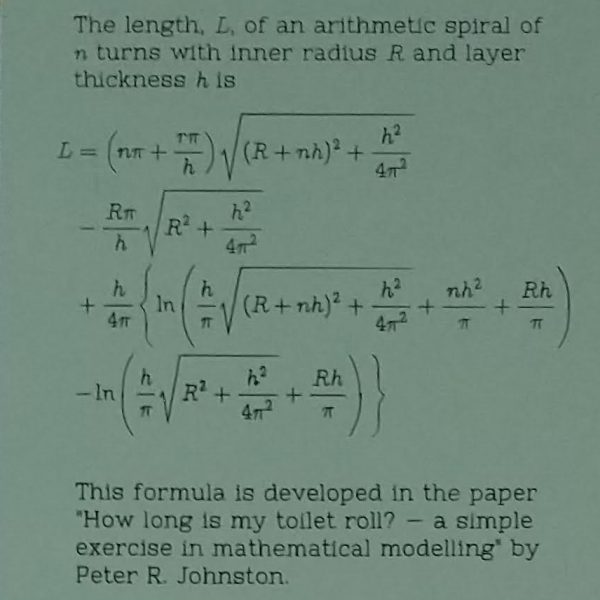
I’m particularly pleased with this formula for the length of a toilet roll, drawn from the paper How long is my toilet roll? – a simple exercise in mathematical modelling by Peter R. Johnston:
I’ve put all of my plotter-related code online. If you just want to make your own postcard, here’s a tool you can use to write a postcard with mathematical TeX.
Here’s a quick video I recorded at the end of my work day, inspired by this tweet.
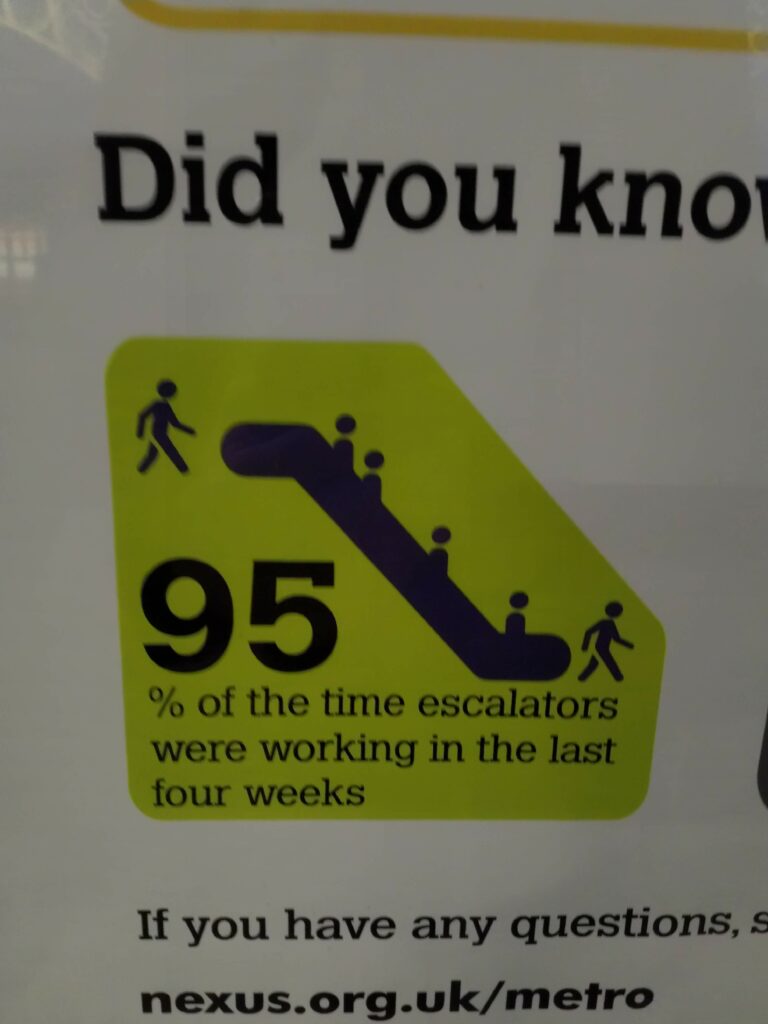
Earlier this year, when getting the train to work was still a thing for me, I noticed this statistic:
I recently had an idea: map the Unix time (seconds since 1st January 1970) to shufflings of a deck of cards. Each second would correspond to a different ordering of the 52 cards.
I wanted to think about how mind-bogglingly huge $52!$ is: $52!$ seconds is more than $2 \times 10^{60}$ years. So even if you spent your entire life watching this thing, you’d leave this world having seen basically none of the possible permutations. Happily, Wikipedia reckons that the heat death of the universe will happen in about $10^{100}$ years, so there’s plenty of time for me to enact my plan.