Katie is running an Aperiodical advent calendar (Aperiodvent 2018), with fun maths Christmas treats every day. Behind the door for 7th December was Parabolic Sewing.
This is not unrelated to what I submitted as my entry to The Big Internet Math-Off last summer. I have been revisiting this idea ready for a class next week in my second year programming module.
I have this idea that I am trying to teach my students to program, rather than to write code in a particular language, so I am bullish about throwing them into a different syntax and allowing them to flex their programming muscles. With this in mind, I intend to spend a brief period drawing graphics using TikZ.
My eye was drawn to this picture from the Aperiodvent day 7 entry (which is from this 2015 post by Vicky Neale on Alex Bellos’ Guardian Blog):
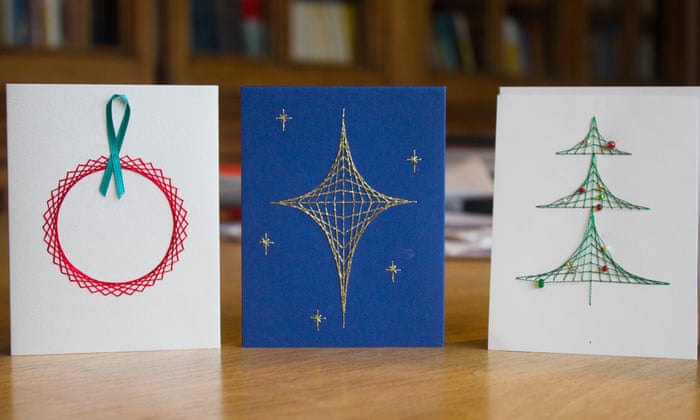
I decided to try to recreate these images using TikZ. First, the images. I’m sure the colours could be made prettier, but here is what I got. Click to enlarge.
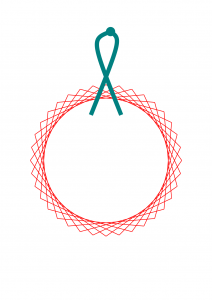
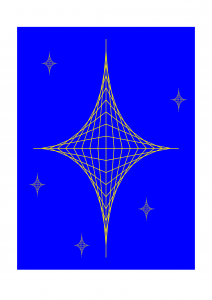
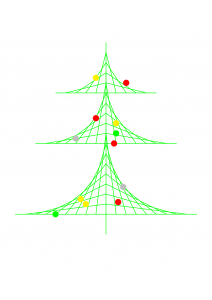
And now the code. I’m sure it, too, could be made prettier, but it works.
\documentclass[oneside]{article}
\usepackage[a4paper,margin=10mm]{geometry}
\usepackage{tikz}

\begin{document}
\pagestyle{empty}
~\vspace{25mm}
\begin{center}
    \begin{tikzpicture}
        \draw [green, ultra thick] (0,0)--(0,-2);
    	\foreach \i in {0,...,9} {
    		\draw [green, ultra thick] (9-\i,0) -- (0,\i) -- (\i-9,0);
    	}
    	\foreach \i in {0,...,7} {
    		\draw [green, ultra thick] (7-\i,7) -- (0,\i+7) -- (\i-7,7);
    	}
    	\foreach \i in {0,...,5} {
    		\draw [green, ultra thick] (5-\i,12) -- (0,\i+12) -- (\i-5,12);
    	}
    	\draw [red,fill=red] (2,13) circle [radius=0.3];
    	\draw [yellow,fill=yellow] (-1,13.5) circle [radius=0.3];
    	\draw [red,fill=red] (-1,9.5) circle [radius=0.3];
    	\draw [yellow,fill=yellow] (1,9) circle [radius=0.3];
    	\draw [green,fill=green] (1,8) circle [radius=0.3];
    	\draw [red,fill=red] (0.8,7) circle [radius=0.3];
    	\draw [lightgray,fill=lightgray] (-3,7.5) circle [radius=0.3];
    	\draw [lightgray,fill=lightgray] (1.7,2.7) circle [radius=0.3];
    	\draw [red,fill=red] (1.2,1.2) circle [radius=0.3];
    	\draw [yellow,fill=yellow] (-2,1) circle [radius=0.3];
    	\draw [yellow,fill=yellow] (-2.5,1.5) circle [radius=0.3];
    	\draw [green,fill=green] (-5,0) circle [radius=0.3];
    \end{tikzpicture}
\end{center}

\newpage
~\vspace{10mm}
\begin{center}
    \begin{tikzpicture}[xscale=0.8,yscale=1.2]
        \draw [blue,fill=blue] (-11,-10) rectangle (11,10);
    	\foreach \i in {0,...,9} {
    	    \draw [yellow, ultra thick] (9-\i,0) -- (0,\i) -- (\i-9,0);
    		\draw [yellow, ultra thick] (9-\i,0) -- (0,-\i) -- (\i-9,0);
    	}
    	\foreach \i in {0,0.2,...,1} {
    	    \draw [yellow] (1-\i+9,4) -- (9,\i+4) -- (\i-1+9,4);
    		\draw [yellow] (1-\i+9,4) -- (9,-\i+4) -- (\i-1+9,4);
    	}
    	\foreach \i in {0,0.2,...,1} {
    	    \draw [yellow] (1-\i-7,7) -- (-7,\i+7) -- (\i-1-7,7);
    		\draw [yellow] (1-\i-7,7) -- (-7,-\i+7) -- (\i-1-7,7);
    	}
    	\foreach \i in {0,0.2,...,1} {
    	    \draw [yellow] (1-\i-8.5,-3) -- (-8.5,\i-3) -- (\i-1-8.5,-3);
    		\draw [yellow] (1-\i-8.5,-3) -- (-8.5,-\i-3) -- (\i-1-8.5,-3);
    	}
    	\foreach \i in {0,0.2,...,1} {
    	    \draw [yellow] (1-\i-3,-8) -- (-3,\i-8) -- (\i-1-3,-8);
    		\draw [yellow] (1-\i-3,-8) -- (-3,-\i-8) -- (\i-1-3,-8);
    	}
    	\foreach \i in {0,0.2,...,1} {
    	    \draw [yellow] (1-\i+5,-5) -- (+5,\i-5) -- (\i-1+5,-5);
    		\draw [yellow] (1-\i+5,-5) -- (+5,-\i-5) -- (\i-1+5,-5);
    	}
    \end{tikzpicture}
\end{center}

\newpage
~\vspace{10mm}
\begin{center}
    \begin{tikzpicture}[scale=1.5]
    	\foreach \i in {0,...,35} {
    	    \pgfmathparse{(mod(\i+7,36))*10}
    	    \node at (\pgfmathresult:5) (A\i) {};
    	    \pgfmathparse{\i*10}
    	    \node at (\pgfmathresult:5) (B\i) {};
    		\draw [red, ultra thick] (A\i.center)--(B\i.center);
    	}
    	\draw [teal, line width=12] (-1,3) .. controls (1,8) .. (0.3,8.5);
    	\draw [teal, line width=12] (1,3) .. controls (-1,8) .. (0.3,8.5);
    	\draw [teal, fill=teal] (0.3,8.5) circle [radius=0.3];
    \end{tikzpicture}
\end{center}

\end{document}
It’s my pleasure meeting you here. I am thrilled with the replica of the beautiful pictures in LateX codes. You’re amazing sir.